DISCLOSURE: THIS POST MAY CONTAIN AFFILIATE LINKS,MEANING That I GET A COMMISSION IF YOU DECIDE TO MAKE A PURCHASE THROUGH MY LINKS, AT NO COST TO YOU. PLEASE READ FULL DISCLOSURE HERE
Is VectorVest a good stock analysis and forecasting platform?
Does its stock rating methodology really work?
Can you really achieve better trading results by following its trading signals?
Are there any better alternatives?
VectorVest Stock Rating System
VectorVest has its own system to analyze and rank stocks for value, safety, and timing and make stock recommendations (i.e. Buy, Hold, and sell).
It has a system to measure three indicators–Relative Value, Relative Safety, and Relative Timing–on a scale of 0-2, with 1 being the neutral point.
Anything above 1.00 is worth looking at.
Anything below 1.00 is a red flag.
Here’s what each indicator does and how it is derived.
Relative Value is an indicator of long-term price appreciation potential compared to the safer returns you could get by investing in AAA corporate bonds.
To determine the stock’s value, VectorVest uses some mathematical formulas to take into account earnings, earnings growth, profitability (positively impacting value ), and interest rates and inflation (negatively impacting value).
Although this correlation applies to quite a number of stocks, there are exceptions.
First of all, interest rates are not ALWAYS a negative attribute to stocks.
For example, banking stocks benefit from a rising rate environment.
Also, inflation might not be an absolutely negative attribute for every company.
For example, food and energy companies do well in an inflationary environment.
On top of that, no one can possibly predict future interest rates and inflation with 100% certainty.
Next, I actually went to its official YouTube Channel to find more answers as to how this Relative Value is exactly calculated, but what I found was a vague explanation that is of no help at all.
Then, I found a link on its website to an E-book by Dr. Bart Diliddo, who is the inventor of the VectorVest system.
In this book, he used Tesla as an example to calculate Relative Value.
Basically, he thinks that it’s worth paying a premium price to buy high-growth stocks because of the potential upside.
As you can see, Tesla was rated a “Strong Buy” in June 2021 despite having a P/E ratio of 154 and its then-price ($679.70) was way higher than its then-value ($177.59).
Yes, I agree that high-growth stocks could have massive upside potential, but the risks are massive too.
Because once its future growth rates miss investors’ expectations, the stock price will tank.
So, how sure are you that this high-growth company could actually maintain its high growth rates?
Even if it could, how long can it last?
By the way, after going through the Tesla example, I am more confused than before.
If I cannot understand the logic, it’s safe for me to avoid using it.
By the way, if you can make sense of it, please let me know in the comments.


On the other hand, Seeking Alpha also provides its own proprietary quantitative ratings and its methodology makes sense to me.
Anyway, let’s not digress, and we will take a closer look at Seeking Alpha Quant ratings later on.
Relative Safety is an indicator of risk.
It is calculated by looking at the following:
- Earnings consistency
- Company size
- Business longevity
- Dividend history
- Debt-to-equity ratio
- Price behavior
Relative Timing is a momentum indicator.
It is calculated from an analysis of the direction, magnitude, and dynamics of a stock’s price movement day over day, week over week, quarter over quarter, and year over year.
On a scale from 0.00 to 2.00, a stock is in an uptrend when its RT is above 1.00.
When the RT is below 1.00, the stock’s price is in a downtrend.
When the price trend flattens out, the RT returns to 1.00.
The downside of Relative Timing is that it’s a lagging indicator, just like any moving average indicator.
It also created an indicator called VST (i.e., the Value, Safety, Timing vector) that is computed from Relative Value, Relative Safety, and Relative Timing based on some mathematical formula.
Stocks with the highest VST are said to have the best combination of Value, Safety, and Timing and are thus recommended as a “buy”.
Now, let’s see an example.

As you can see, the Relative Timing is almost 2 (probably one of the highest ranked), which means it’s a very good time to buy the stock, ClearField, based on the VectorVest System.
Below is the stock price chart of ClearField.
As you can see, it is actually the WORST time to buy the stock because it fell almost 60% in the next 10 months.
During the same period, the stock market staged a strong rally where the S&P 500 went up almost 20%.

VectorVest Trading Platform
VectorVest has a trading platform that allows you to connect to your broker and place trades directly from the platform.
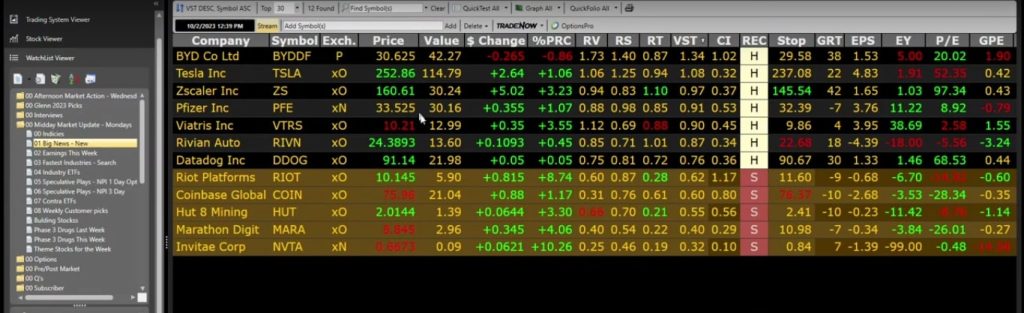
On the platform, you can easily see the RV, RS, RT, and VST values for each stock and also its growth rate and EPS.
You can also find tools such as Watchlist, Stock Screener, VectorVest Graph, and ProTrader to help you find stock ideas and analyze stocks.
As shown below, it can also help you find support and resistance levels automatically.
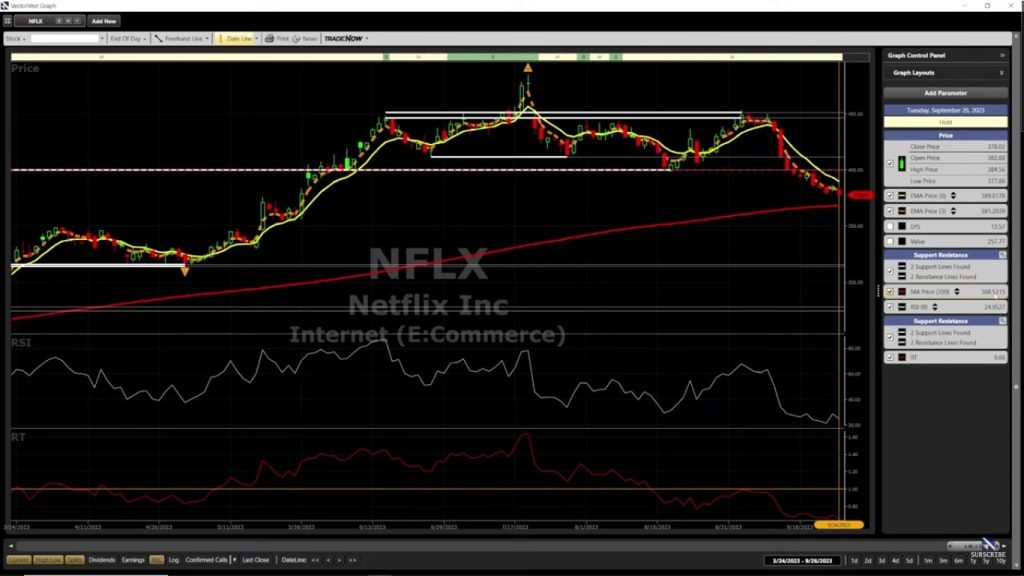
You can choose from all the available technical and fundamental indicators (e.g., EPS) to help you analyze the charts.
However, the number of indicators is quite limited as compared to TrendSpider and TradingView.
If you are tired of going through charts, you can use VectorVest ProTrader to help you find the following technical breakout patterns:
- Channels
- Bollinger Bands Crossovers
- ADXR Crossovers
- EMA Crossover
- MA Crossovers
- ADX Crossovers
- Envelope Crossovers
- Stochastics Oscillator Crossovers
- Relative Moving Averages
- Directional Indicator Crossover
- Adxr Crossover
- DPO Crossovers
- WMA Crossovers
- MACD Crossovers
- RSI Crossovers
- Combination Crossovers
So, basically, the key selling point of VectoVestor is its proprietary stock rating system- Relative Value, Relative Timing, and Relative Safety.
You can use these proprietary indicators to help you make trading decisions on top of your technical analysis.
VectorVest Products & Pricing
There are three different pricing plans for VectorVest software:
- Basic: $69/month
- Enhanced: $99/month
- Premium: $149/month
The basic plan gives you the following:
- Stock analysis (i.e., Value, Safety, Timing) and ratings(i.e., Buy, Sell, Hold) of over 18,000 stocks & ETFs in the United States, Canada, Australia, Europe, United Kingdom)
- Daily stock picks from the VectorVest team
- Stock screeners & watchlists
- Free educational courses
- Phone support
The key difference between the basic, the enhanced plan, and the premium plan is that you only get real-time data if you are on the premium plan while data is only updated at the end of the day for the basic plan, and data is delayed by 15 minutes for the enhanced plan.
Apart from that, VectorVest’s proprietary dynamic trading stop (to help you lock in profits) is only available for members on the enhanced plan and premium plan.
Lastly, you will only get access to the live coaching group, ProTrader (pre-built and customizable searches to find technical breakouts), AutoTimer(to alert you when you need to make a trade based on your strategy), and advanced trade alerts if you are on the premium plan.
VectorVest Vs Zacks
Both VectorVest and Zacks provide stock ratings to help traders and investors make decisions.
However, the way they rate stocks is very different.
Zacks provides a daily updated list of Strong Buy and Strong Sell stocks using the Zacks Rank, while VectorVest uses Relative Value, Relative Safety, and Relative Timing to make specific stock recommendations (i.e., Buy, Hold & Sell).
Let’s look at how Zacks Rank is calculated.
Zacks’ stock ranking is founded entirely on one premise:
“Earnings estimate revisions are the most powerful force impacting stock prices.”, according to Zacks’ Founder and CEO, Len Zacks.
So, what that means is that if the stock’s earnings estimate is revised higher, then the Zacks’ rank of the stock will be high.
Conversely, if the stock’s earnings estimate is revised lower, then the Zacks’ rank of the stock will be low.
Now, how does Zacks get all the stocks’ earnings estimates?
It collects and analyzes the stocks’ earnings estimates from all the brokerage analysts that follow the stocks.
Then, it uses a mathematical formula to calculate the Zacks’ Rank of the stock based on the analysts’ earnings estimates.
There are a total of 5 different ranks:
- Zacks Rank #1 (i.e., Strong Buy)
- Zacks Rank #2 (i.e. Buy)
- Zacks Rank #3 (i.e. Hold)
- Zacks Rank #4 (i.e., Sell)
- Zacks Rank #5 (i.e,. Strong Sell)
When Zacks Rank issues a “Strong Buy” or “Buy” (Zacks Rank #1 or #2), what it means is that the stock’s earnings estimates are rising.
If the stock’s earnings are going to be more than expected, then the stock would be undervalued and the stock price would likely go up.
When Zacks Rank issues a “Strong Sell” or “Sell” (Zacks Rank #5 or #4), what it means is that the stock’s earnings estimates are declining.
If the stock’s earnings are going to be less than expected, then the stock would be overvalued and the stock price would likely go down.
Another difference between Zacks and VectorVest is that you can use VectorVest to find stocks that could go up in the next 1-3 years.
On the other hand, Zacks’ stock ratings are ONLY for short-term trading (i.e., the next 1 to 3 months), but not for long-term investment.
Publicly traded companies are required to report their quarterly earnings, so the “earnings estimate revisions” indicator that Zacks uses is only valid for at most one quarter.
Also, since the only input they use to calculate Zacks’s rank is the analysts’ earnings estimates, the accuracy of Zacks’ Rank pretty much depends on how accurate the brokerage analysts’ estimates are.
However, if you go and see the analysts’ estimates for many stocks, they could differ widely from each other.
Can you really trust the brokerage analysts’ analysis?
They are the people who follow the companies closely, so they should know better about the companies than most people.
Yes, that’s true.
But, they are not always right.
If you go and look at a lot of the US biotechnology stocks, most of these stocks rated “Buy” by analysts have dropped at least 50% off their high.
In the short term, there are so many factors influencing the stock price.
I don’t think it’s wise to rely solely on analysts or their earnings estimates to make your trading decisions.
According to its website, a hypothetical portfolio consisting of stocks with Zacks Rank # 1 Strong Buy stocks had an average annual return of 24.17%, compared to an average annual return of 10.82% for the S&P 500 from Jan 1, 1988, to Sep 4th, 2023.
That is very impressive for a hypothetical portfolio.
Naturally, I wanted to find out how they actually measured the performance and whether this performance was indeed true.
From its disclosure on its website (as shown below), I learned that this hypothetical portfolio was rebalanced monthly from Jan 1, 1988, to Dec 31, 2013, and thereafter rebalanced weekly from Dec 31st, 2013 to April 2nd, 2018, with zero transaction costs.
The issue with this is that ONLY stocks that are on the Zacks Rank #1 Strong Buy List at the beginning of the month or the week are included in the calculations.
But the stocks on that List constantly change throughout the month or week.
Based on my observation, some stocks ONLY stay on the Zacks Rank #1 Strong Buy List for as short as one day.
So, rebalancing monthly or weekly doesn’t reflect the true performance at all.
![]()
Also, there are a lot of issues with the way the returns are calculated from this hypothetical portfolio.
First of all, transaction costs are considered zero, which was not true back then.
When you buy and sell shares, there is also the bid-ask spread you have to pay.
If you take all these into account, this will reduce the returns.
In other words, the actual returns would be much less.
All in all, I am not confident about the results on its website.
So, which is better, VectorVest or Zacks?
Personally, I avoid using both VectorVest and Zacks, and I use Seeking Alpha’s Qant rating in my stock research and analysis.
Leave a Reply