DISCLOSURE: THIS POST MAY CONTAIN AFFILIATE LINKS,MEANING That I GET A COMMISSION IF YOU DECIDE TO MAKE A PURCHASE THROUGH MY LINKS, AT NO COST TO YOU. PLEASE READ FULL DISCLOSURE HERE
So, is Simply Wall Street reliable?
Is it a useful stock research and analysis platform?
Can you actually use it to help you pick good stocks?
Are there better alternatives?
After trying out Simply Wall St as well as almost all the other stock research and analysis platforms out there, I will help you answer all the questions above and make a more informed decision.
How You Can Use Simply Wall Street
Simply Wall Street is a stock research and analysis platform that covers about 150,000 stocks worldwide.
Simply Wall Street Stock Analysis Reports
All the stock analysis reports are generated automatically in the same format, using data from company financials as well as analysts’ revenue estimates.

There are a total of 10 sections in the stock report:
- Executive Summary
- Share Price & News
- Valuation
- Future Growth
- Past Performance
- Financial Health
- Dividend
- Management
- Ownership
- Company Information
Personally, I think that only the “Valuation” and “Future Growth” sections might be of some value to you in helping you make an investment decision.
In all the other sections (e.g. “Share Price & News”, “Past Performance”, “Dividend”, “Ownership”, etc), you can easily get the same information for free online.
So, let’s take a closer look at the “Valuation” section.
First of all, it gives you the typical financial ratios P/E, P/B, and P/S, and also does a P/E ratio comparison among peers.
Anyway, you can find this data on all the other stock analysis platforms.
Next, it gives you the underlying company’s fair value.
It uses discounted cash flow analysis to calculate the fair value.
If you are unfamiliar with the discounted cash flow analysis method, it’s basically a company valuation method that is based on the premise that “the fair value of a company is the total value of its future free cash flow discounted to today’s prices.”
This method is commonly used by a lot of stock analysts as well as many other stock research and analysis platforms.
But, there are A LOT of assumptions in this method.
Why?
Because no one can predict with absolute certainty the exact free cash flow the company is going to generate every single year from today onward.
To estimate the fair value of a company, analysts make assumptions about the company’s future revenue as well as its growth rate.
As a result, no two analysts would arrive at the same fair value even though they use the same methodology.
For Simply Wall St, it takes analysts’ revenue and growth rate estimates and then plugs them into a mathematical formula.
Here’s the problem.
Some stocks are widely covered by many analysts, while others are only covered by a few analysts.
Let’s take “Microsoft” for example.
Microsoft is covered by 88 analysts.
Yet, only 34 of those analysts submitted the estimates of revenue or earnings used as inputs to generate the Simply Wall St report.
Initially, I thought Simply Wall St would take the average of all the 34 analysts’ estimates of free cash flow for the next 5 years because that would be a more appropriate way to get the data.
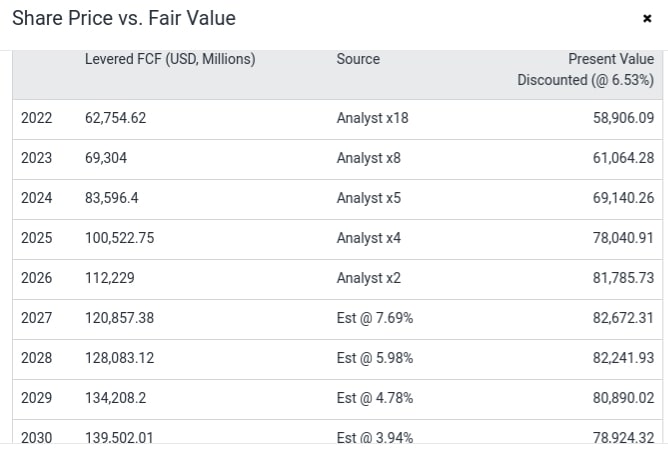
But, it seems that it uses 18 analysts’ free cash flow estimates for the first year.
Then, it uses 8 analysts’ (probably different analysts from above?) free cash flow estimates for the second year.
For the subsequent years, it used even fewer analysts’ estimates (and probably different analysts too.)
So, it really makes me doubt the reliability of the “fair value” provided by Simply Wall Street.
So, can you still rely on this “fair value estimate” to make your investment decision?
Personally, I think you should NEVER use this data alone to determine whether or not a stock is a good buy.
Why?
It’s NOT the actual fair value of the stock.
In fact, let’s take a look at a few more fair-value estimates of Microsoft stock that I found from other sources.
From Gurufocus, the Peter Lynch fair value estimate for Microsoft is $345.70, as of 15th Nov, 2023.
According to Morningstar, the estimated fair value increased to $370, as of 30th Oct, 2023.
From Stock Rover, the estimated fair value is $339.02 as of 15th Nov, 2023.
Now, what about Simply Wall St?
The estimated fair value provided by Simply Wall St is $378.37 as of 15th Nov, 2023.
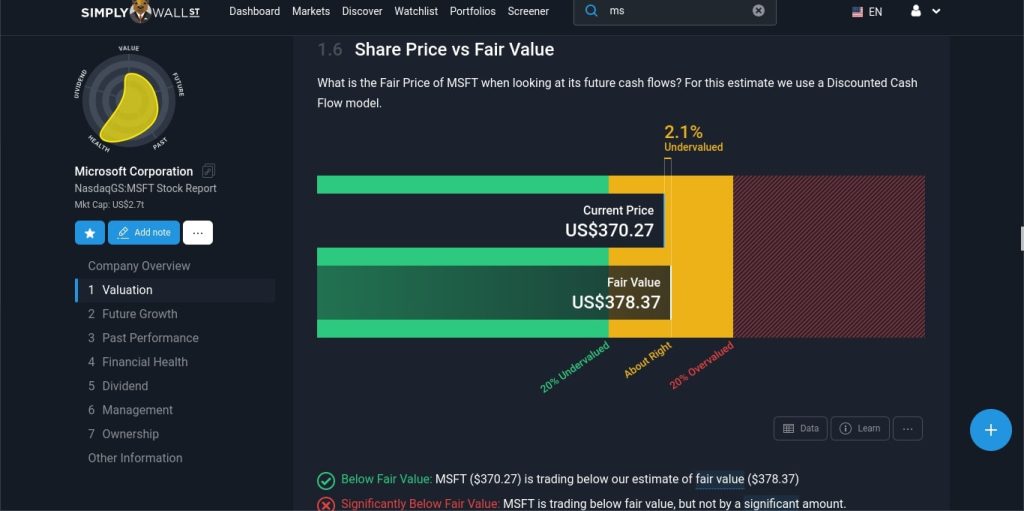
As you can see, the estimated fair value for the same stock didn’t differ by a lot across a few stock research and analysis platforms.
So, what I would recommend is that you calculate the average of all the fair value estimates and then use that as one of your references in your investment decision-making.
Here’s another strategy that I personally use.
After you have decided to invest a certain amount of money in a stock, it’s wise to build a full position in this stock through multiple purchases instead of using all of your allocated capital to buy the full position at one time.
So, what do I mean by that?
Let’s say that you plan to invest $30,000 in Microsoft.
Instead of buying $30,000 worth of Microsoft stock at one time, you buy the stock in three equal installments at different price levels.
For example, you could buy $10,000 worth of Microsoft stock at $280/share, another $10,000 worth of Microsoft stock at $260/share, and the final $10,000 worth of Microsoft stock at $240/share.
By doing so, you could reduce your risk with a lower average cost price., especially considering that the current market rally is currently over-extended.
Now, let’s move on to the other two sections ” Financial Health” and “Future Growth” and see whether they are helpful.
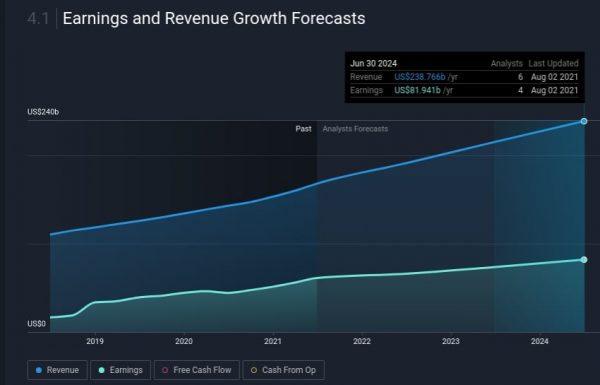
For the “Future Growth” section, you will find analysts’ earnings and revenue growth as well as earnings per share forecasts presented in graphical format.
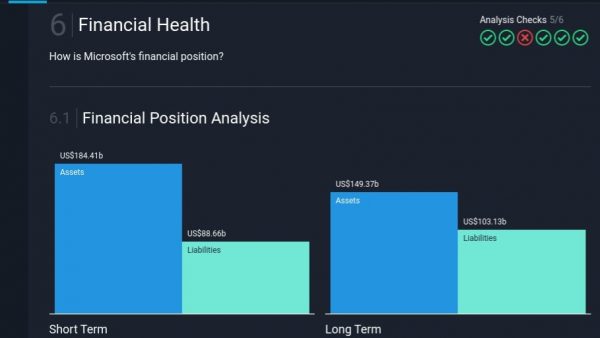
For the “Financial Health” section, you will find assets vs liability for both short-term and long-term, debt to equity ratio as well as an oversimplified balance sheet in graphical format.
So, after going through everything, you can see that the main advantage of using Simply Wall St is that basic financial data and ratios are presented to you in an easy-to-read graphical format.
If you are a new investor, you might find this format very beginner-friendly.
Also, Simply Wall St covers a lot of international stock markets.
So, that will be good for you if you are investing internationally.
However, what I don’t really like about Simply Wall St is that the financial information and data provided are too basic and general for in-depth stock research and analysis.
(Personally, I use Morningstar and Seeking Alpha to find investment ideas and research stocks)
On top of that, I don’t feel that there is anything really unique or proprietary about Simply Wall St.
Yes, the financial information and data on Simply Wall St are much easier to read in graphs and tables.
But, I would prefer a more specific and in-depth stock analysis.
Why?
Because I don’t think I can decide right away whether or not I want to invest in the stock (and also at what price) after going through the stock analysis on Simply Wall St.
There is a lot of important information I still need to be able to make an informed decision:
- What is the company’s competitive advantage compared to its competitors?
- What is the company’s strategy to achieve sustainable long-term growth?
- How good is the company’s management team?
- What are the potential risks of investing in this company?
How Much Simply Wall Street Costs
There are three different pricing plans:
- Free
- Premium ($10/month)
- Unlimited ($20/month)
So, what is the main difference between these pricing plans?

The main difference is the limit on the number of company reports you can get access to every month as well as the number of portfolio stocks analyzed.
With the free plan, you can only have 5 company reports per month and 5 portfolio stocks analyzed.
For the Premium Plan, you have up to 30 company reports per month and 30 portfolio stocks analyzed.
If you want unlimited data for all the stocks, then the Unlimited Plan gives you that.
Also, with both Premium Plan and Unlimited Plan, you get a stock screener as well.
Simply Wall Street Vs Seeking Alpha Premium
So, how does Simply Wall Street compare with Seeking Alpha Premium?
There are a few key differences between Seeking Alpha Premium and Simply Wall St.
Firstly, Simply Wall Street provides coverage of international stocks while Seeking Alpha only covers US-listed stocks.
Secondly, Simply Wall Street does not provide stock ratings while Seeking Alpha provides three types of stock ratings and dividend grades to make it easier for you to find investment ideas and analyze stocks.
Lastly, Seeking Alpha Premium has all the financial information and data that you can find on Simply Wall St and also its authors’ in-depth stock analysis to help you better understand the underlying company.
Personally, I love using Seeking Alpha’s platform to find good investment ideas and research stocks.

For each stock, you can find the latest Seeking Alpha Premium ratings on the stock:
- SA Author Ratings ‒ ranging from Strong Buy to Strong Sell
- Wall Street Ratings – consensus and price targets on the stock by Wall Street Analysts
- Quant Ratings ‒ based on over 100 metrics, updated daily
The most interesting of all is its proprietary Quant rating.
It was developed by CressCap, a quantitative analytics and data platform that was acquired by Seeking Alpha.
So, what exactly is Quant Rating, and how does it really work?
Quant rating is derived by comparing over 100 metrics for the stock to the same metrics for the other stocks in its sector.
These metrics include the company’s financial data, stock price performance, and analysts’ estimates of future revenue and earnings.
There are five types of Quant ratings:
- Strong Sell (i.e. a score of 1)
- Sell (i.e. a score of 2)
- Hold (i.e. a score of 3)
- Buy (i.e. a score of 4)
- Strong Buy (i.e. a score of 5)
The advantage of this method is that you can use Quant Rating to find the best performer of any particular industry or sector.
Here’s one of the best ways to make use of Seeking Alpha ratings.
Every day, Seeking Alpha publishes a list of stocks that earn top ratings from Seeking Alpha authors, Wall Street analysts, and its proprietary Quant System.
I think this list of Top-Rated Stocks is like a gold mine that could help you increase your investment returns significantly.
Personally, I like to shortlist stocks with Strong Buy ratings and Factor Grades (Value, Profitability, Growth, Momentum, and Earnings Estimate) of at least B and above.
For example, one of recent Seeking Alpha Strong Buy stock recommendations is Galiano Gold.
Galiano Gold was rated a Strong Buy in Jan 2024 when its share price was $0.94.
Less than 4 months later (22nd April 2024), its share price went up by almost 50%.
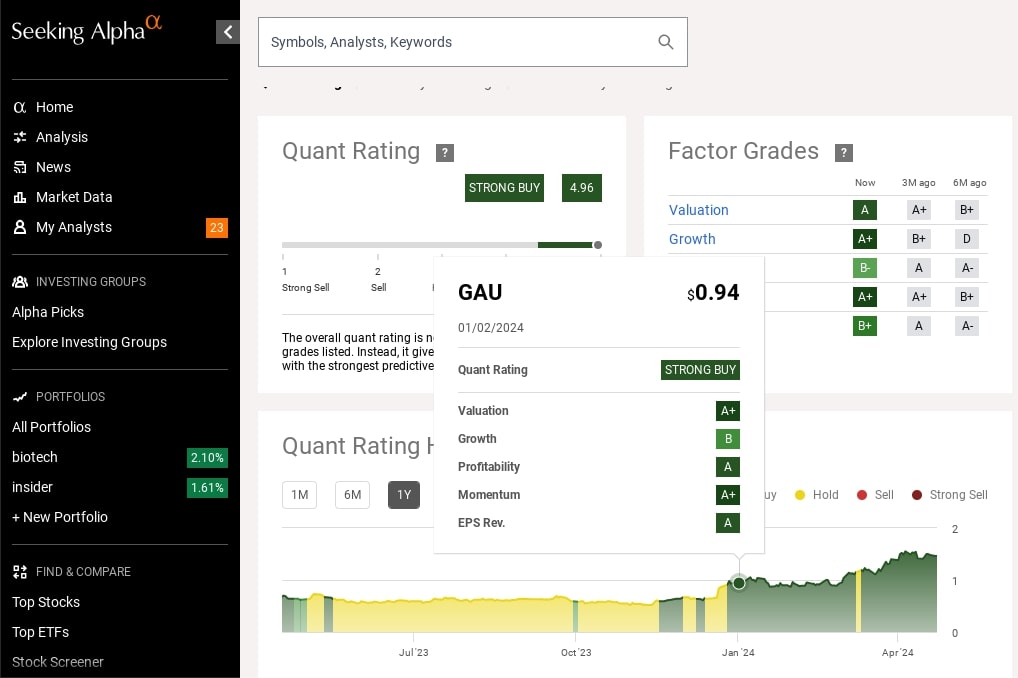
Below is the performance comparison between Seeking Alpha’s Strong Buy Recommendations vs S&P 500.
As you can see, it outperformed the S&P 500 by a large margin.

Seeking Alpha also provides you with a stock screener that you can use to find investment ideas in the stock market.
You can filter stocks with Buy/Hold/Sell quant ratings, author recommendations, or sell-side ratings.
You can also screen stocks from a range of financial metrics including valuation, momentum, and profitability.
Lastly, you can also create your screener from scratch or use one of Seeking Alpha’s preset screeners.

If you don’t want to create your own stock screens, there are also preset stock screens for you to choose from.

Lastly, the thing that I love the most about Seeking Alpha Premium is the in-depth stock analysis.
What is more, I find it especially useful to go through opposing camps of views on the same stock that I am researching on.

Why?
Because it really helps me consider all the potential risks and future opportunities involved before making my decision.
So, how much does Seeking Alpha cost?
For Seeking Alpha, there are three types of pricing plans:
- Basic: Free
- Seeking Alpha Premium: $299/year
- Seeking Alpha Pro: $2400/ year (mostly for hedge fund managers)
Right now, there is a free 7-day trial + 20% OFF for you to test drive it and see if it works for you.
With the basic free version, you can only get very limited access to Seeking Alpha’s stock in-depth news and analysis.
You also won’t get access to Seeking Alpha Author Rating and Quant Rating, Top-rated stocks, and all the premium stock analyses.
So, is it worth paying for Seeking Alpha Premium?
$269/year works out to be about $22.4/month (i.e., $0.80/day).
A cup of Starbucks coffee costs about $2.75.
Personally, I have been using Seeking Alpha Premium for my stock research and analysis. It saves me a lot of time and also gives me a lot of good stock ideas.
Simply Wall Street Vs Morningstar
There are a few key differences between Simply Wall Street and Morningstar.
First of all, Morningstar provides proprietary stock ratings, valuations, and research reports.
Also, Morningstar is specifically focused on helping you find good-quality stocks for long-term appreciation.
If you are a value investor, you might find Morningstar very helpful because it helps you identify all the good companies and also all the companies that are currently undervalued.
For each stock, you will also get the stock research report that makes the case for or against investing in it.
On top of that, I also like its “Bulls Say Bears Say” where you can get different perspectives from both sides of the camp.
Lastly, Morningstar not only covers stocks but also covers bonds, mutual funds, and ETFs, while Simply Wall St only covers stocks.
In terms of pricing, Morningstar Premium memberships are available at the following term lengths and prices:
- $34.95/month
$249/year$199/year (i.e., $16.5/month)
If you go for the annual plan or above, it is much cheaper than Simply Wall St’s Unlimited Plan.
So, I would recommend Morningstar Premium if you are a long-term value investor.
You can give Morningstar Premium a try for free for 7 days!
Simply Wall Street Vs Stock Rover
The main difference between Simply Wall Street and Stock Rover is that Simply Wall Street presents you with a selected set of financial data in an easy-to-understand graphical format while Stock Rover provides you with a much more comprehensive set of fundamental data and financial ratios in an interactive table format for you to work with.
What is more, you can easily compare all the similar companies in the same sector side by side in the Stock Rover platform.
If you’d like to see the comparison in chart format, Stock Rover can help you do that as well.
Basically, if you are an active fundamental, Stock Rover is a much better choice because it makes it so much easier for you to do your own fundamental analysis on companies that you are interested in.
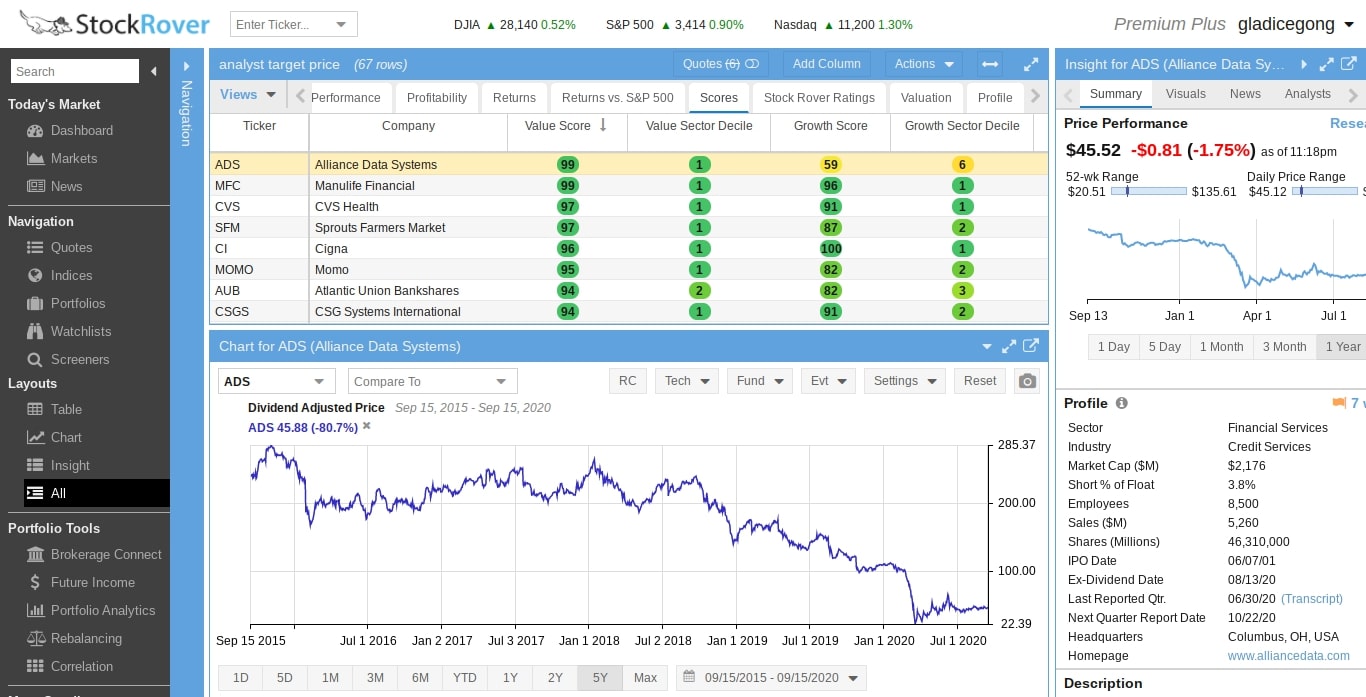
If you want to look for investment ideas, Stock Rover has one of the most powerful fundamental stock screeners.
It provides over 650 metrics.
To put it in perspective for you, the FREE stock screeners you can easily find online provide you with much fewer metrics (i.e., less than 100).
Moreover, Stock Rover’s metrics cover a wide range of areas such as earnings, growth, profitability, financial strength, capital efficiency, price performance, momentum, dividends, analyst ratings, and stock ratings.
Basically, you have ALL the financial and fundamental data on any US & Canadian stocks in one place.
For example, if you are looking for growth stocks.
You can customize your criteria by mixing and matching any number of the 29 metrics under “Growth”.
As you can see, Stock Rover gives you a lot of flexibility and control.

Simply Wall Street Vs Motley Fool Stock Advisor
Now, let’s compare Simply Wall St with Motley Fool Stock Advisor.
The main difference between Simply Wall St and Motley Fool Stock Advisor is that Motley Fool Stock Advisor makes specific stock recommendations.
It gives you a deep dive into the recommended stocks, so you can understand how they actually analyze the company and why they recommend it after considering everything, including potential risks.
On the other hand, Simply Wall St is a stock research platform where you can get basic financial data and information in an easy-to-read format.
By the way, I mainly used Motley Fool Stock Advisor to get stock ideas because they have found quite a few good investment ideas over the years.
But I don’t buy every single stock recommendation by Motley Fool Stock Advisor.
From there, I will read their research team’s analysis and then also do my own independent research on platforms such as Stock Rover and Morningstar before I decide whether or not I want to invest in the stock.
Will the Motley Fool Stock Advisor always be right about their stock recommendations?
No, because no one can be right about their stock picks 100% of the time.
Let me sidetrack a bit here.
If any stock picking service tells you that they have a close to 100% success rate on their stock picks and can guarantee you high investment returns, you should definitely stay away.
Even Warren Buffett has loss-making stocks in his portfolio, but he still achieves above-average returns because a few big gainers in the portfolio can make up for the underperformers.
What I like about the Motley Fool Stock Advisor is that they are very open and transparent about their bad investments.
As a member, I can see the performance of ALL its past and current stock recommendations (even for closed positions).
Some other stock-picking services that I’ve tried don’t publish the performance of all their past and current stock recommendations, so it’s not easy for you to find out their true track record.
So, if you are thinking of getting into stock investing, I recommend the Motley Fool Stock Advisor because I think there are a lot of well-researched stock recommendations with long-term growth potential.
By the way, I don’t buy every single stock recommendation by Motley Fool Stock Advisor.
I mainly used Motley Fool Stock Advisor to get stock ideas because they have a track record of finding multi-baggers.
So, I like to use the Motley Fool Stock Advisor as an important source of investment ideas.
I will read their research team’s analysis and then also do my own independent research on platforms such as Stock Rover and Morningstar before I decide whether or not I want to invest in the stock.
Thanks Gladice for this review, very helpful in each areas and highlights . In these time, when you get so many king of financial prophets on the net, fell a little more back to basic. Would What you say about combining Stock Rover and Fool? overkill for a start ? useful on some end? they could be complementary for an advised investor?
One comment about simply wall; it’s about being able to provide international listing quite easily, and still on the free plan.
Thanks! You have tackled the exact queries I have about comparing these research tools! I had looked at Simply Wall St and the points you have made about their service are very useful. I’m also interested in non-US stocks – unfortunately not covered by Stock Rover. You don’t mention non-US stock coverage by Morningstar or Motely Fool so I’ll investigate the scope of coverage for those. Thanks again.
Yes, also looking for the best tool for UK shares. I hear (not validated) the UK version of Motley fool is not as good as US.
So what are all the smart uk guys using?
If you’re smart, you won’t use SWS for anything. The whole entire site is setup to deceive users. It is so funny…by doing exactly the opposite of every recommendation they gave for gold mining stocks, my portfolio is up 30%+ since inception 8-months ago. If I hadn’t picked my own stocks I’d be down 45% according to the stocks they push. Indeed, most of the mining stocks in their “10 Best” section are complete garbage. On top of that, they actively try to get you to liquidate performing stocks by changing data points on you. My positions in five hugely undervalued gold mining stocks are considered, by any measure, a Value portfolio — with small, consistent dividends. SWS described those dividends as “inconsistent” even though they’ve been paid every quarter for the last 4 years in a row. And it labels this whole portfolio as an “income portfolio of overvalued stocks.” Ha! Ha! Ha! Whatever. It is so obviously purposely deceptive that it isn’t even worth mentioning, however, all I can say is: Use SWS advice/recommendations and data at your own risk because…most of it is 180-degrees opposite of reality.
dividends paid 4 years is much to short to be considered consistent.Motley fool in most cases their reporters do invest in their own recommendations.
Simply wall street give a plain and simple set of facts for you to make your own decisions, if your capable.
Great review, many thanks!
The payout ratios are incorrect a lot of the time on SWS. To be fair, a lot of the other sites get that part wrong as well. It’s ok for beginners. The presentation and charts are nice. I would prefer a little more detail and better explanations and would be nice if they went back at least 5 years, not just two or three. Like I said I like the overall presentation and simple format but you can find most of the same info by doing a search or checking the company reports. I would definitely not buy a stock based on this info a lone.
Great reviews of each. Seeking Alpha is too US centred. It provides a wide range of opinions. I tried SWS and was disappointed. Not all data is updated on time. The portfolio function does not let you account for transaction costs separately, although they are upgrading the portfolio function sometime this year. Stock Rover is tedious and is also very US centric. I am in Canada so that’s not very helpful for me. US investing is not easy as ones faces a withholding tax on dividends plus the foreign exchange risk. Morningstar.ca is ok. Motley Canada is ok. The highly rated by Mark Hulbert investment letter I used was The Investment Reporter. Unfortunately, after 82 years of service it mysteriously stopped in mid-June of this year without so much a word of “by your leave” …MPL Communications, its publisher, has also disappeared. For my own support I am considering designing an Excel 365 dashboard and scrapping the relevant data from reliable sources. Though your positive comments on Motley (Canada) and Morningstar (Canada) will encourage me to investigate them further. Again thank for your reviews, much appreciated.
Thanks Gladice for this review, very helpful, it teaches me a lot as a beginner