DISCLOSURE: THIS POST MAY CONTAIN AFFILIATE LINKS,MEANING That I GET A COMMISSION IF YOU DECIDE TO MAKE A PURCHASE THROUGH MY LINKS, AT NO COST TO YOU. PLEASE READ FULL DISCLOSURE HERE
Is IBD SwingTrader good?
Can it really help you make money from swing trading consistently?
Is IBD SwingTrader membership worth it?
After trying out IBD SwingTrader, I want to share with you everything that I’ve found out. So, you can make an informed decision yourself.
What Is IBD SwingTrader
IBD SwingTrader is one of Investor’s Business Daily products.
It’s designed to help you with swing trading by giving you everything from the IBD SwingTrader team’s stock picks to full trade setups and instant buy/sell alerts.
Basically, everything is taken care of for you.
All you need to do is follow their trade plan.
But, would you really make money consistently by following their trade alerts?
Later on, we will answer this question by examining their stock picks and trading alerts.
Now, how is IBD SwingTrader different from IBD Leaderboard?
Both IBD Leaderboard and SwingTrader incorporate IBD’s CAN SLIM investing system in their respective trading strategy.
The difference is that IBD Leaderboard is designed to help you with position trading in strong up-trending market conditions where you enter at the beginning of an uptrend and potentially hold the trade for weeks or even months and years.
On the other hand, IBD SwingTrader is designed to help you take advantage of the price volatility in the short term in sideways market conditions.
Swing trading is a strategy that focuses on taking smaller gains in short term trends and cutting losses quicker.
The gains might be smaller, but done consistently over time they can compound into excellent annual returns.
Swing trading positions are usually held a few days to a couple of weeks, but can be held longer.
How IBD SwingTrader Works
So, how does IBD SwingTrader work?
Below is the IBD SwingTrader dashboard where you can see all the current trades, past trades and recent alerts.
It is very easy to use, even for beginners.

For each trade, you get the trade setup, buy zone, stop loss as well as profit goal.
So, how do they actually determine what stocks to trade and when to buy and sell?
First of all, they would identify strongest stocks poised for big gains using the CAN SLIM strategy as well as advanced algorithms.
CAN SLIM is an investment strategy that investors use to identify stocks that are poised to grow faster than average.
Each letter in the acronym stands for a key attribute.
- C: Current quarterly earnings per share growth of at least over 20% from the same quarter in the prior year with
- A: Annual EPS growth of at least 20% over the last three to five years
- N: New products, management, or positive new events
- S: Scarce supply (e.g. share buyback and insider buying)
- L: Laggard stocks are preferred within the same industry (An RSI reading below 30 suggests that the stock is oversold while a reading of above 70 suggests that a stock could be overbought)
- I: Pick stocks that have institutional sponsorship by a few institutions with recent above-average performance
- M – Determine general market direction (CANSLIM stocks perform well in bull markets)
So, most of the trades are based on a bullish reversal trading strategy because they believe that these fundamentally strong stocks will eventually go up after a short term pullback.
A typical trade entry is above a short-term resistance level like the previous day’s high.
The average length of a trade is about 5 to 10 day.
The objective is to take small and quick profits.
Let’s take a look at one of the current trades as of my writing today.

In the chart, a buy signal is issued once the previous downtrend is broken and the share price closes above the 10-day moving average and breaks previous day high.
Unlike the 7% to 8% stop loss that IBD Leadboard adopts, IBD SwingTraders sets a maximum stop loss of 2% to 3%.
As for profit target, IBD SwingTraders aims for 5% to 10% gain.
This way, it gives you a comfortable 3-to-1 profit-to-loss ratio.
It is designed for sound risk management because you don’t want one huge loss quickly wipe away a lot of progress made with smaller gains.
Well, it all sounds very good in theory.
In reality, can IBD SwingTrader help you achieve better returns?
Now, let’s take a look at its past performance.
IBD SwingTrader Performance
Below is the performance comparison between IBD SwingTrader and S&P 500.
As you can see, the year-to-date returns of IBD SwingTrader is 6.88% while S&P 500 had a year-to-date return of 25.82% as of 23rd Dec 2021.
So, you would make much more by simply buying the S&P 500 index ETF.

| Year | IBD SwingTrader performance |
| 2021 | average 0.29% per trade (a total of 360 trades) |
| 2020 | average 1.13% per trade (a total of 490 trades) |
| 2019 | average 0.149% per trade (a total of 133 trades) |
| 2018 | average 0.439% per trade (a total of 74 trades) |
| 2017 | average 0.629% per trade ( a total of 79 trades) |
The good thing is that it’s still overall positive every year.
But, the total return of your entire investment portfolio depends on the profit per trade, your trade size and the number of trades.
Assuming that you have an investment portfolio of $100,000, a full position for a trade would be about 10% of your entire portfolio which is $10,000.
So, below is the approximate annual profit you would have gotten using IBD SwingTrader:
(My formula: annual total profit-= average % profit * $10,000 * total number of trades for the year)
Let’s compare IBD SwingTrader performance with S&P 500 for the past 5 years by assuming that you’ve invested $100,000 in S&P 500 at the beginning of each year.
| Year | IBD SwingTrader | S&P 500 |
| 2021 | $10,440 | $26,890 |
| 2020 | $55,370 | $16,260 |
| 2019 | $1,981 | $28,880 |
| 2018 | $3,248 | $-6,240 |
| 2017 | $4,969 | $19,420 |
As you can see, S&P 500 has beat IBD SwingTrader three years out of five years.
The year 2020 is an exceptional year where the market crashed suddenly and then staged a strong V-shaped recovery shortly after that.
IBD SwingTrader’s strategy tends to outperform in strong up-trending market conditions.
In other years, S&P 500 tends to outperform IBD SwingTrader.
How Much Does IBD SwingTrader Cost`
There are two different pricing plans:
- Monthly: $69/month
- Annual: $699/year
So, is it worth getting IBD SwingTrader subscription?
If you are trading a portfolio size of $100,000, you would have made $6,880 in the whole year of 2021.
With that, you easily make back your subscription fees and more.
BUT, let’s not forget the amount of time you have to put in to execute and manage ALL the trades.
There’s a total of more than 350 trades in the year 2021.
350 trades!
If you have a full-time job, you would not be able to manage it at all.
On the other hand, you could easily have made $25,820 without having to put in any time if you had just invested in the S&P 500.
On top of that, if you are relying on swing trading for a full-time income, you would need to make at least 30% to 40% a month CONSISTENTLY on a capital of $100,000.
That’s very unlikely to be achieved for more than 90% of the traders out there.
Personally, I don’t recommend that you trade stocks to grow your wealth.
Or worse, you try to trade stocks for income.
If you are looking for ways to grow your wealth, it’s better to invest in high-quality companies with long-term growth potential.
Below is the performance comparison between Motley Fool Stock Advisor and S&P 500 between 2002 and 26 June 2024.
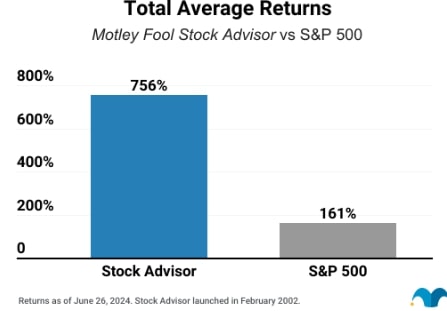
As of 26 June 2024, average Motley Fool Stock Advisor recommendations have returned over 756% since inception while the S&P 500 has returned 161%.
In short, the Motley Fool Stock Advisor has outperformed the market 4 to 1.
But, what about its individual stock picks?
This metric is important because I might not be buying every single stock recommendation made by the Motley Fool Stock Advisor.
Below is a table that shows you the performance of individual stock picks over the years.
As of 6th September 2023, Motley Fool Stock Advisor has had 173 stock recommendations with 100%+ returns.
[Past performance is no guarantee of future results. Individual investment results may vary. All investing involves risk of loss.]

Will the Motley Fool Stock Advisor always be right about their stock recommendations?
No, because no one can be right about their stock picks 100% of the time.
Let me sidetrack a bit here.
If any stock picking service tells you that they have a close to 100% success rate on their stock picks and can guarantee you high investment returns, you should definitely stay away.
Even Warren Buffet has loss-making stocks in his portfolio, but he still achieves above-average returns because a few big gainers in the portfolio can make up for the under-performers.
What I like about the Motley Fool Stock Advisor is that they are very open and transparent about their bad investments.
As a member, I can see the performance of ALL its past and current stock recommendations (even for closed positions).
Some other stock-picking services that I’ve tried, don’t publish the performance of all their past and current stock recommendations, so it’s not easy for you to find out their true track record.
So, if you are thinking of getting into stock investing, I highly recommend the Motley Fool Stock Advisor because I think there are a lot of well-researched stock recommendations with long-term growth potential.
By the way, I don’t buy every single stock recommendation by Motley Fool Stock Advisor.
I mainly used Motley Fool Stock Advisor to get stock ideas because they have a track record of finding multi-baggers.
For example, it first recommended Nvidia back in 2005, then again in 2009, then again in 2017.
It first recommended The Trade Desk in 2017, and has recommended it multiple times over the years as shown below.

It first discovered Netflix back in 2003 and has recommended it multiple times over the years as shown below.

So, I like to use the Motley Fool Stock Advisor as an important source of investment ideas.
I will read their research team’s analysis and then also do my own independent research on platforms such as Seeking Alpha and Morningstar before deciding whether or not I want to invest in the stock.
In terms of pricing, Motley Fool Stock Advisor is also much more affordable than IBD SwingTrader.
Usually, its annual subscription is $199.
Right now, there’s a special limited-time 50% OFF offer* for new members for the first year when you click the link here to try it out for 30 days with a Membership-Fee-Back Guarantee. (*Billed annually. Introductory price for the first year for new members only. First-year bills at $89 and renews at $199)
So, for $99 a year- that’s just $1.80 a week – you can gain unlimited access to their library of expert stock recommendations which are carefully selected to help you grow your wealth.
Limited Time: Claim Your 50% OFF Stock Advisor Introductory Offer For New Members
Thank you for all your information. You have been very helpful!!