DISCLOSURE: THIS POST MAY CONTAIN AFFILIATE LINKS,MEANING That I GET A COMMISSION IF YOU DECIDE TO MAKE A PURCHASE THROUGH MY LINKS, AT NO COST TO YOU. PLEASE READ FULL DISCLOSURE HERE
Is Ziggma a really good stock research platform?
How do you actually use it to find good stocks for investment?
Also, how does Ziggma compare with its competitors such as Seeking Alpha and Stock Rover?
After trying out all these stock research platforms, I want to share with you the key differences between them and all the pros and cons of each platform.
Ziggma Vs Stock Rover Vs Seeking Alpha: Stock Screener
Ziggma has a quite decent stock screener with main filters such as Sector, Industry, Ziggma Score, Valuation, Growth, Profitability, Financial Position, and Technical Indicator.
For each main filter, you can mix and match your desired sub-filters to find stocks that meet your criteria.
For example, under “Valuation”, there are 9 different metrics that you can customize using the slider:
- Valuation Score
- PE Ratio
- PE(Forward)
- Price/Book
- Price/Tangible Book
- Analyst Target
- Yield
- Market Capitalization
- EV/EBITDA
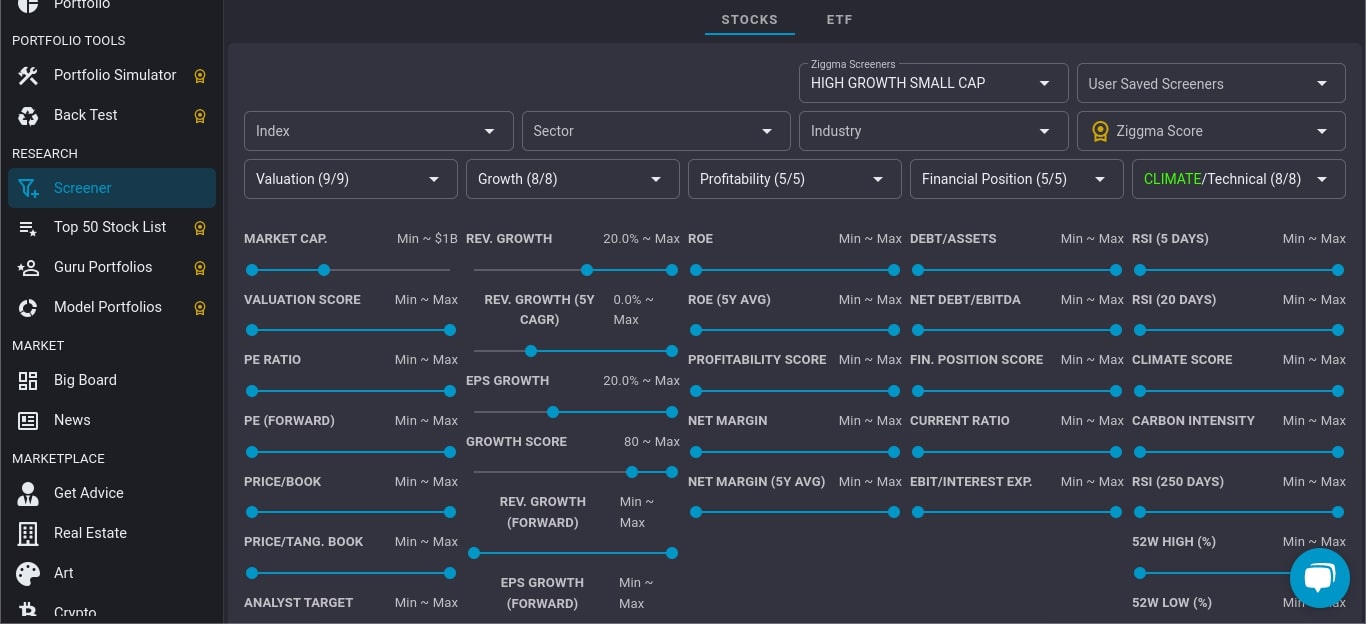
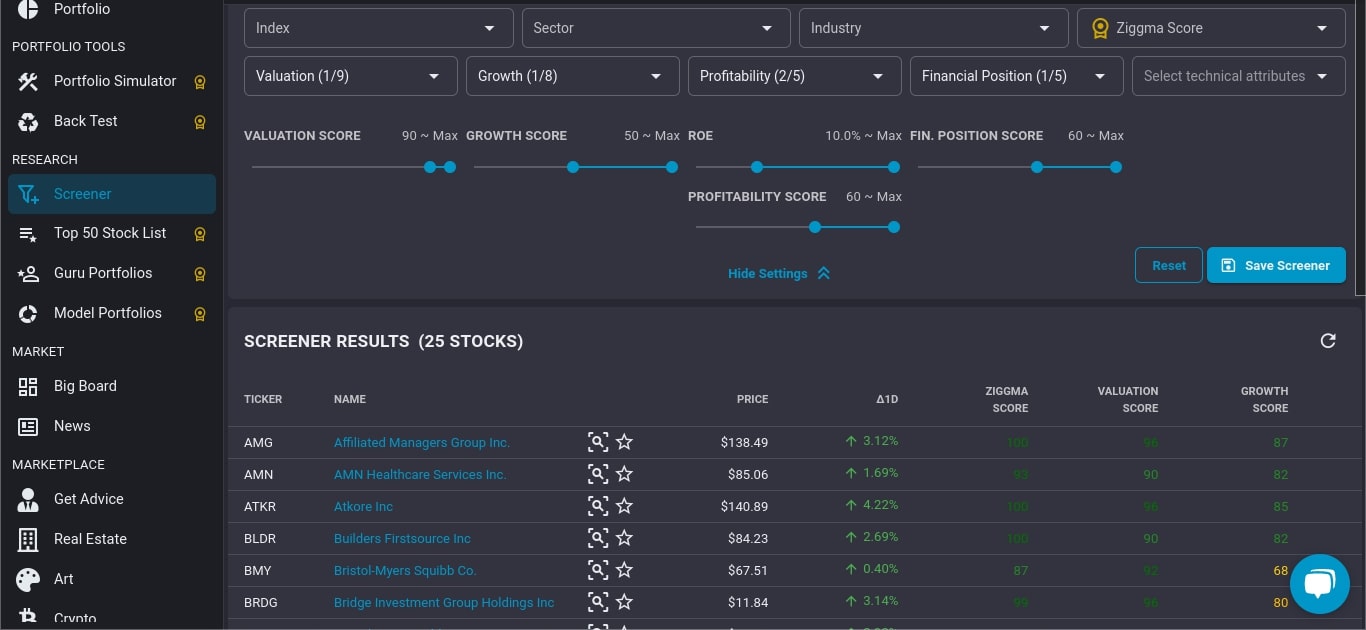
Now, let’s assume that I am looking for undervalued stocks.
To cast a wider net, I want to include stocks with an average score on growth, profitability, and financial position.
Ziggma gives me a total of 25 stocks that meet my criteria.
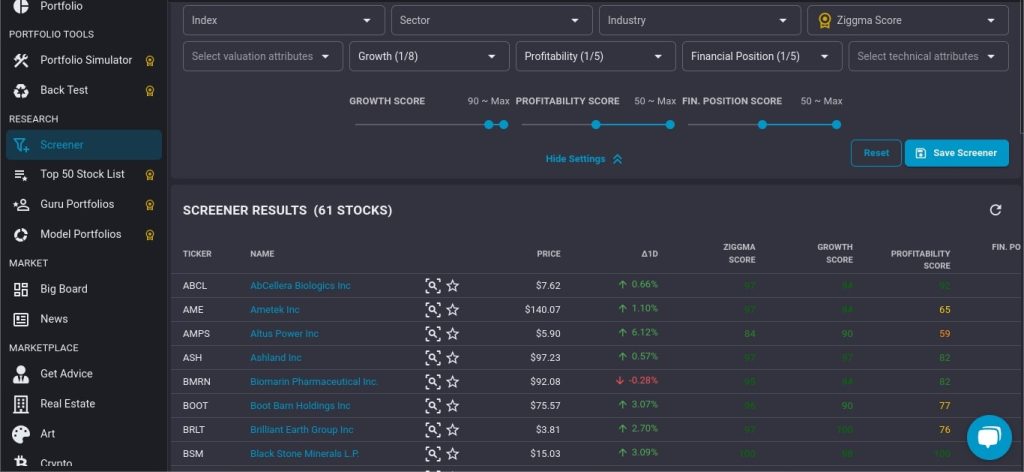
To find high-growth stocks, I simply set the growth score to 90 and above with an average score on both profitability and financial position.
This gives me a list of 62 stocks.
Overall, it’s quite easy and quick to find stock ideas based on Ziggma sub-scores.
It also provides a limited number of pre-defined stock screeners such as high-growth small cap and best of NASDAQ 100.
However, if you are an experienced investor who has specific metrics (e.g. financial data, ratios, etc) that you want to look at, then Ziggma might not be a very good choice for you.
For that, I recommend Stock Rover.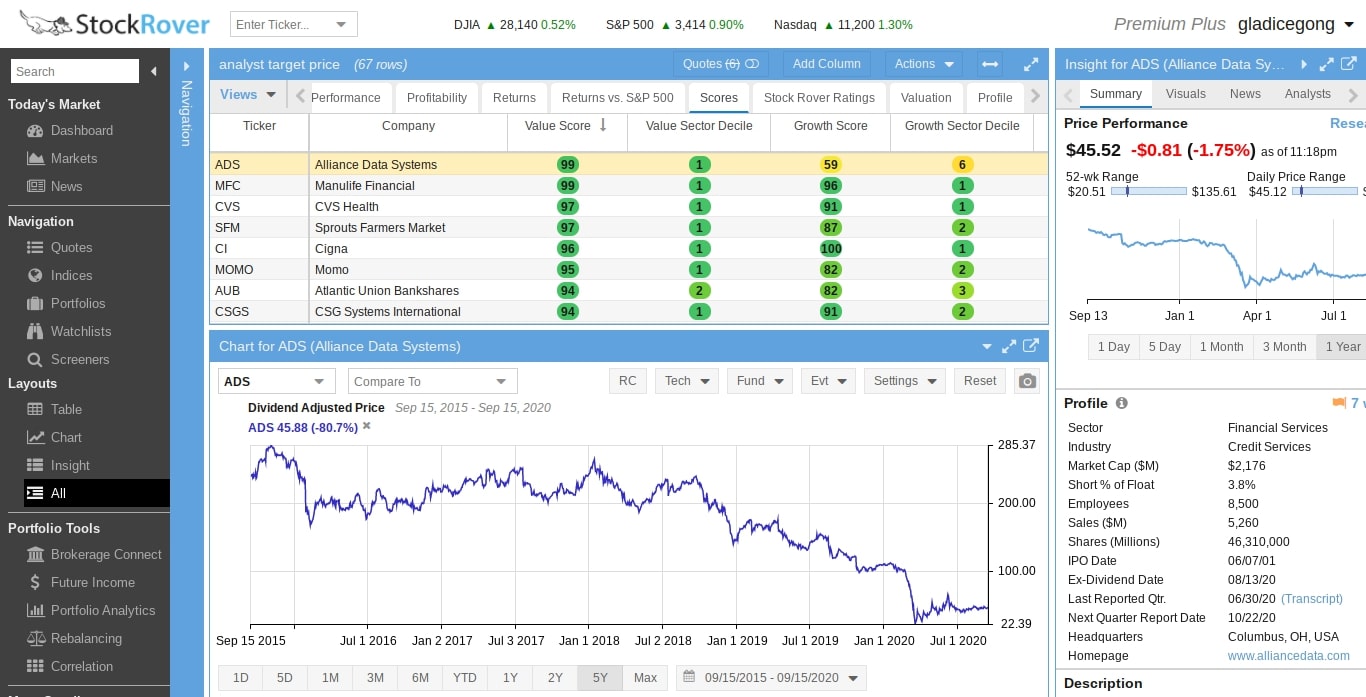
Stock Rover has one of the most powerful fundamental stock screeners.
It provides over 650 metrics.
To put it in perspective for you, the FREE stock screeners you can easily find online provide you with much fewer metrics (i.e. less than 100).
Moreover, Stock Rover’s metrics cover a wide range of areas such as earnings, growth, profitability, financial strength, capital efficiency, price performance, momentum, dividends, analyst ratings, and stock ratings.
Basically, you have ALL the financial and fundamental data on any US & Canadian stocks in one place.
For example, if you are looking for growth stocks.
You can customize your criteria by mixing and matching any number of the 29 metrics under “Growth”.
As you can see, Stock Rover gives you a lot of flexibility and control.

Now, what about the Seeking Alpha stock screener?
Seeking Alpha provides you with quite a number of “pre-defined” stock screeners such as Top Stocks By Quant, Top Value Stocks, Top Growth Stocks, Top Rated Dividend Stocks, Top Small-Cap Stocks, Top Technology Stocks, and Top Healthcare Stocks.
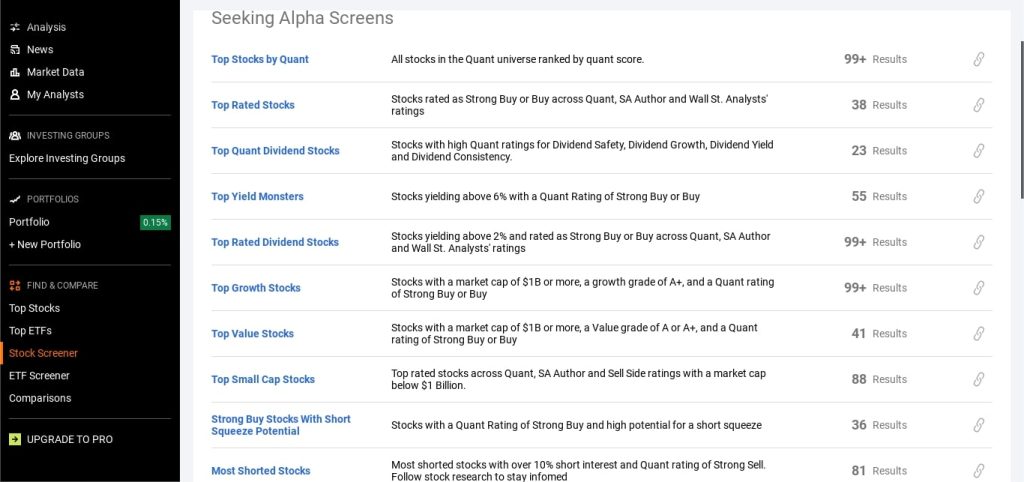
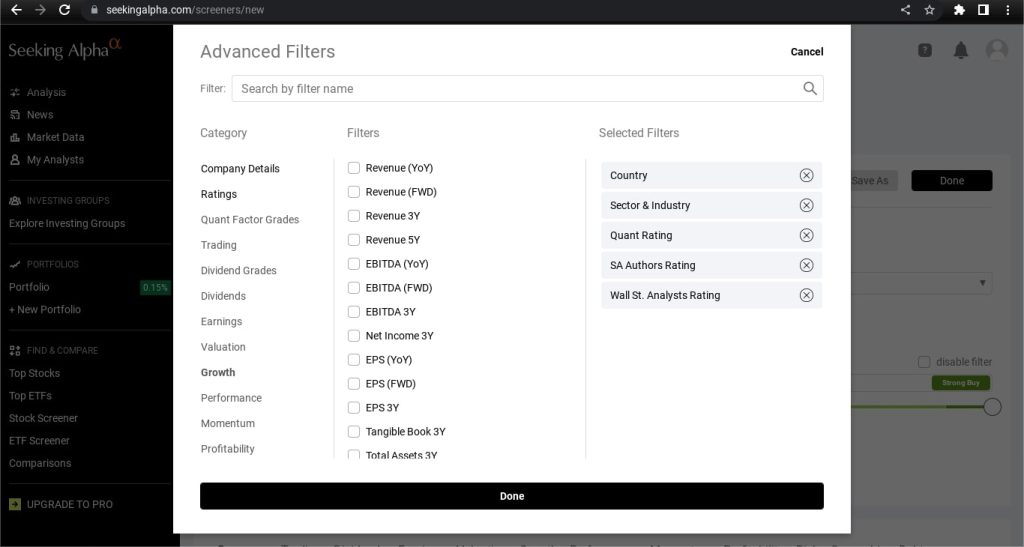
Of course, you can also use its advanced filters to screen for stocks that meet your specific criteria.
As shown below, you can mix and match the filters from different categories such as ratings, quant factor grades, earnings, valuations, growth, and profitability.
Although it might not have as many fundamental metrics as Stock Rover, it should be good enough for fundamental investors.
Ziggma Vs Stock Rover Vs Seeking Alpha: Stock Score/Rating
So, what is Ziggma Score?
How is this stock score derived?
According to the Ziggma website, Ziggma Score captures more than 40 key indicators for growth, profitability, valuation, and financial situation.
Then, its algorithm applies big data analytics to do fundamental analysis and ranks the stock against its industry peers on a scale of 0 to 100 in terms of growth, profitability, valuation, and financial health.
The higher the score, the better.
Below is the breakdown of the Ziggma Score for META (formerly Facebook).
As you can see, the overall Ziggma score is 93 with profitability, valuation, and financial health each scoring more than 90, compared to its peers.
In terms of growth, it scores worse than its peers.
It’s unclear how much weight Ziggma gives to each factor when it calculates the overall Ziggma Score, as Ziggma prefers not to disclose too much about its methodology.

The benefits of using Ziggma Score are plenty.
First of all, it helps you save a lot of time in your research.
Secondly, you can draw a lot of useful insights by examining the sub-scores (i.e. growth score, profitability score, valuation score, financial health score)
Now, how does Ziggma Score compare with Stock Rover stock ratings and Seeking Alpha stock ratings?
Personally, I think that both Seeking Alpha Ratings and Stock Rover Stock Ratings are more robust than Ziggma Score.
Seeking Alpha provides three different types of ratings on the stock:
- SA Author Ratings ‒ ranging from Strong Buy to Strong Sell
- Wall Street Ratings – Consensus and price targets on the stock by Wall Street Analysts
- Quant Ratings ‒ based on over 100 metrics, updated daily
The most interesting of all is its proprietary Quant rating.
It was developed by CressCap, a quantitative analytics and data platform that was acquired by Seeking Alpha.
So, what exactly is Quant Rating, and how does it really work?
Quant rating is derived by comparing over 100 metrics for the stock to the same metrics for the other stocks in its sector.
These metrics include the company’s financial data, stock price performance, and analysts’ estimates of future revenue and earnings.
There are five types of Quant ratings:
- Strong Sell (i.e. a score of 1)
- Sell (i.e. a score of 2)
- Hold (i.e. a score of 3)
- Buy (i.e. a score of 4)
- Strong Buy (i.e. a score of 5)
The advantage of this method is that you can use Quant Rating to find the best performer of any particular industry or sector.
So, how exactly is Quant Rating calculated?
Quant Rating is derived after taking into account the following five “Factor Grades”:
- Value
- Growth
- Profitability
- Momentum
- EPS Revisions
The Factor Grade is determined by comparing the relevant metrics for the factor for the stock to those for the other stocks in the same sector.
For example, to determine the grade for the “Growth” factor, metrics such as past sales growth, projected earnings growth, and stock price performance for the stock will be compared to the same metrics for the other stocks in the same sector.
Then, each factor is assigned a grade, from A+ to F.
Grade A+ means that the stock has the highest growth potential compared to its peers in the same sector.
On the other hand, a grade of F means that the stock has the lowest growth potential compared to its peers in the same sector.
So, how do you use Seeking Alpha’s Factor Grades?
The value, growth, and profitability grades give you a snapshot of the stock’s fundamentals, while the momentum and EPS revisions grades tell you if the stock is gaining momentum.
So, if you are looking for value stocks, you just filter out all the stocks with a “Value” Grade of A or A+.
After that, you further research and analyze these value stocks one by one.
The advantage of Factor Grade is that you get a very quick idea of what type of stock it is. (e.g. a value stock? a growth stock? momentum stock?)
Apart from ratings, you can also get tons of useful financial and fundamental information (i.e. Earnings, Valuation, Growth, Profitability, Peers, Dividend, etc) and news and analysis on the stocks you are researching or stocks that you own in your portfolio all in one place.
So, how have Seeking Alpha’s Strong Buy Recommendations compared against the S&P 500?
Do take note that the performance is based on backtesting.
From 2010 to March 2024 (as of my writing), Seeking Alpha Strong Buy achieved a total return of $245,380 based on $10,000 in investment capital while the S&P 500 achieved a total return of $51,032.

Next, let’s look at Stock Rover Stock Ratings.
Just like Seeking Alpha, Stock Rover calculates its stock ratings based on the past performance of the underlying company relative to its industry group peers.
Ratings are calculated in the following categories:
- Growth
- Valuation
- Efficiency
- Financial Strength
- Dividends
- Momentum
While the exact methodology is not disclosed, Stock Rover does reveal that it looks at the trajectory and volatility of a number of different metrics in a given category (e.g. growth, valuation, or financial strength) over time relative to peers.
Metrics that are considered more important are given a higher weight and less important metrics get a lower weight when it comes to calculating the overall category rating.
For example in the growth category, Stock Rover looks at the following metrics:
- Revenue Growth
- Operating Income Growth
- Net Income Growth
- EPS Growth
- Revenue Per Employee
- Next Year’s Expected Revenue Growth
- Next Year’s Expected EPS Growth
- Morningstar Grades – Growth
- Intangible Assets as a % of equity growth
Below is an example of the breakdown of Stock Rover stock ratings:

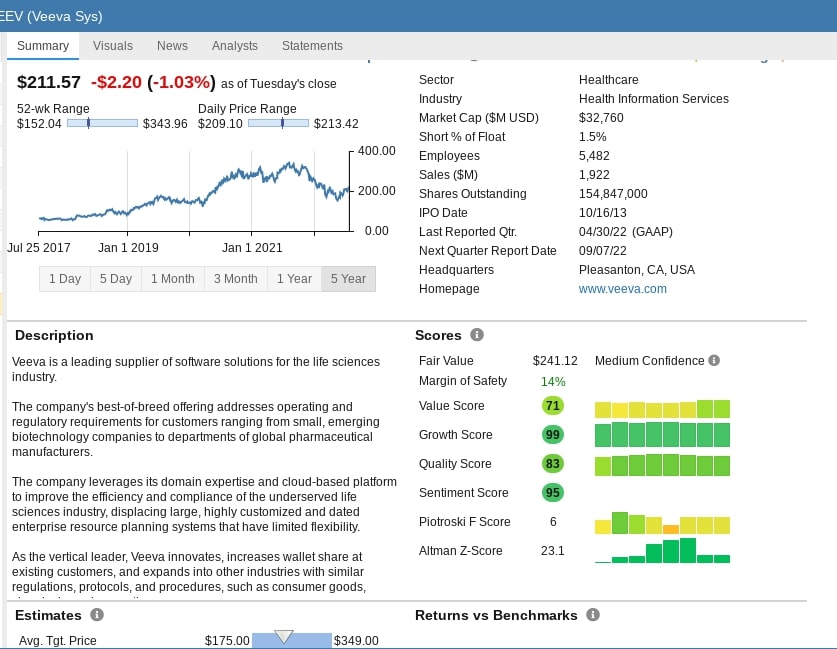
In addition to stock ratings and category ratings, Stock Rover also provides different types of scores (e.g. value score, growth score, quality, and sentiment).
The scores are different from the stock ratings in that the scores are computed for a company vs. the market as a whole while the stock ratings are computed for a company vs its peers.
The scores range from 0 (the worst) to 100 (the best).
They are also color-coded, so it is easy to see at a glance whether the score is great (dark green), good (light green), OK (yellow), bad (orange), or awful (red).
The scores panel also shows the score for previous years, so you can see the trend over time.
Ziggma Vs Stock Rover Vs Seeking Alpha: Stock Research
In terms of stock research, all of them provide financial data, financial ratios, future earnings estimates and etc.
The key difference is that both Seeking Alpha and Stock Rover provides 10 years of historical financial data while Ziggma only provides the past 5 years of financial data.
Between Seeking Alpha and Stock Rover, Stock Rover gives you much more flexibility and control over how you want to use these raw financial data to analyze and compare stocks.
This is especially helpful if you are a numbers person.
Another key difference is that you can get more in-depth stock analysis from both Seeking Alpha and Stock Rover than from Ziggma.
With Ziggma, you get to read a short summary of strengths and weaknesses and the financial ratios for “Valuation”, “Growth”, “Profitability”, and “Balance Sheet and Liquidity”.
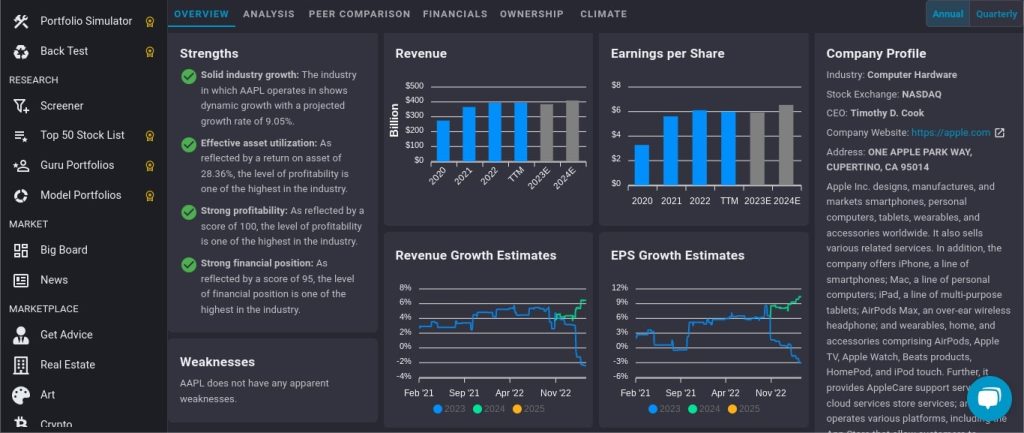
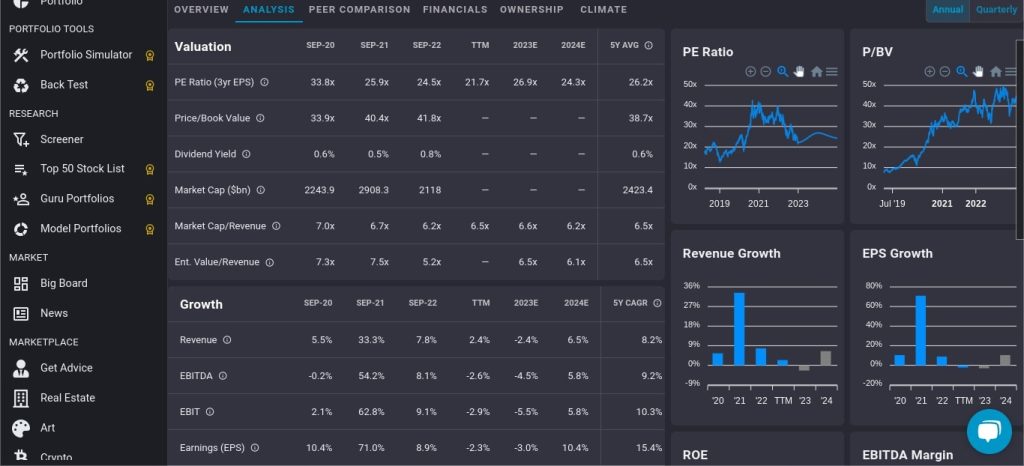
Stock Rover gives you everything that you see inside Ziggma plus more.
With Stock Rover, you get interactive research reports that are updated daily.
It’s an 8-page Research Report where you can see all the important financial and valuation information in easy-to-understand tables and charts.
For example, you will see analysts’ consensus (i.e. how many of them recommend “strong buy”, “buy” or “sell”).
Also, you will see its quantitative score which consists of four types of scores:
- Value score
- Growth score
- Quality score
- Sentiment score
Under this section, you will also see what is the estimated fair value of the stock as well as the margin of safety.
Further down the report, you will find all the valuation summary, growth summary, peer analysis summary (i.e. how it compares to its competitors in the industry), profitability summary, financial statement summary, valuation and profitability history, and dividend details and history.
In short, the Stock Rover research report helps you organize and make sense of all the financial data.
This is very useful for investors who don’t have any accounting background and also don’t like to crunch numbers.
With Seeking Alpha, you not only get access to all the financial ratios but also get to read in-depth stock analysis from the bull side as well as the bear side.
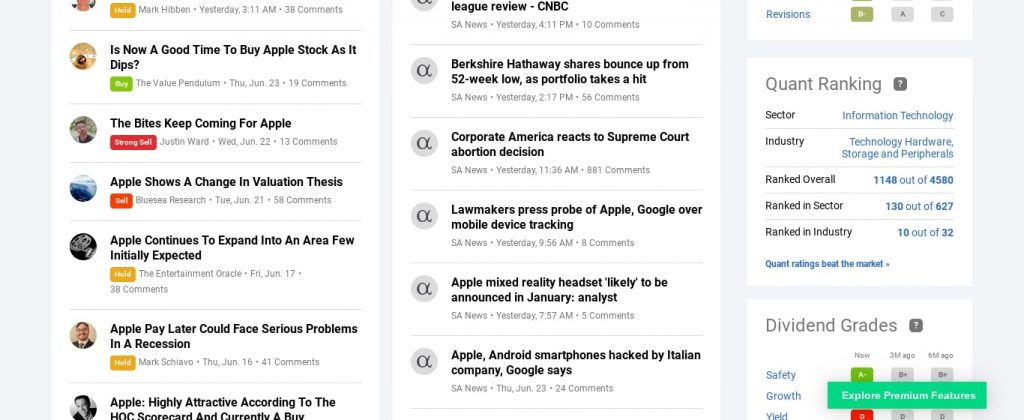
I find it very useful because I love to hear from people who have different views from mine on the same stock and it might help me see any potential risks that I didn’t consider.
Ziggma Vs Stock Rover Vs Seeking Alpha: Portfolio Tracker
Ziggma, Stock Rover, and Seeking Alpha all provide portfolio tracker and portfolio analytics tools.
You can link your brokerage accounts to sync all your latest positions.
They also allow you to monitor your positions and analyze the stocks inside your portfolio.
For example, Seeking Alpha shows you the latest stock ratings, upgrades/downgrades, financial ratios, and performance for each stock inside your portfolio.
There are two unique portfolio tools that are only offered by Ziggma:
- Portfolio Simulator
- Back Test
Before you make a trade, you can use the portfolio simulator to see what kind of impact it would have on your portfolio.
The Ziggma Portfolio Simulator lets you evaluate a trade’s impact on:
- Diversification
- Portfolio risk
- Portfolio yield
- Overall growth rate of your portfolio holdings
- Overall profitability of your portfolio holdings
You can use the “Back Test” to test a strategy or portfolio to see the result it would have produced over a given period.
However, out of all these three, Stock Rover’s portfolio analytics and management tools are more useful to investors.
With Stock Rover, you can do portfolio re-balancing while you cannot do it with Seeking Alpha and Ziggma.
Below is a list of things you can do with Stock Rover:
- Get detailed portfolio analytics for any time period you choose (e.g. risk-adjusted return, volatility, beta, Sharpe Ratio, component performance, etc)
- Get a detailed analysis of how the individual positions in your portfolio are contributing to the overall portfolio return
- Re-balance portfolio at the sector and individual position level
If you are a dividend stock investor, you will be thrilled to know Stock Rover provides you with tools to help you track future dividend income.

Ziggma Vs Stock Rover Vs Seeking Alpha: Pricing
Lastly, let’s compare the pricing between Ziggma, Stock Rover, and Seeking Alpha.
Ziggma currently has two pricing plans:
- Free
- Ziggma Premium: $9.90/month (or $89/year)
The differences between the free plan and Ziggma Premium are that you get access to Ziggma Score, Top 50 Stocks, Alerts, Model Portfolio, Guru Portfolio and etc.
However, the “Guru Portfolio” and “Model Portfolio” are not very impressive.
Here’s why.
“Guru Portfolio” only shows 10 stocks in the investment guru’s portfolios.
There are no “latest changes” in the portfolio (e.g. new holdings or reduced holdings).
If you want to see the latest investment activities of your favorite investment guru, there are much better platforms such as Gurufocus, Dataroma, and Whale Wisdom.
As for the “Model Portfolio”, I don’t think it’s useful because everyone’s financial situation and objectives are different.
For Seeking Alpha, there are three types of pricing plans right now:
- Basic: Free
- Seeking Alpha Premium: $299/year
- Seeking Alpha Pro: $2400/ year (mostly for professional traders)
With the basic free version, you can only get very limited access to Seeking Alpha stock in-depth news and analysis.
You also won’t get access to Seeking Alpha Author Rating and Quant Rating, Top-rated stocks, and all the premium stock analyses.
Ziggma’s pricing is cheaper than Seeking Alpha Premium, but I think that you can get much more value from Seeking Alpha Premium.
Now, let’s look at Stock Rover’s pricing plans.
Stock Rover Premium is priced slightly cheaper than Seeking Alpha Premium, but Stock Rover Premium Plus is slightly more expensive.
Below are the four different plans provided by Stock Rover:
- Free
- Essentials at $7.99/month (or $6.67/month if billed annually)
- Premium at $17.99/month (or $15.00/month if billed annually)
- Premium Plus at $27.99/month (or $23.33/month if billed annually)
So, what is the main difference between Stock Rover Premium Plus and Stock Rover “Essential” & “Premium”?
With Premium Plus, you can take full advantage of its powerful stock screener.
What that means is that you not only get ALL the 650 metrics to help you screen stocks, but you can also screen on historical data and create more complex screeners using its “custom equation” function.
Also, in terms of financial data and fundamental metrics, you will get unlimited data on everything.
For example, you will get fair value and margin of safety for all stocks, unlimited Stock Rover scores (i.e. value score, growth score, quality score, and sentiment score), unlimited stock ratings, and unlimited investor warnings.
The price difference between Stock Rover Premium and Premium Plus is just a few dollars per month, so you will get much more value for your money by choosing Premium Plus.
Stock Rover Premium Plus is also the plan that I am using right now for investment research.
If you are serious about growing your wealth through investing, I highly recommend that you give its Stock Rover Premium Plus Plan a try for 14 days at absolutely no costs (no credit card required).
Great work . I love to read it and it’s going to help me to choose the right services. Thank you for your support