DISCLOSURE: THIS POST MAY CONTAIN AFFILIATE LINKS,MEANING That I GET A COMMISSION IF YOU DECIDE TO MAKE A PURCHASE THROUGH MY LINKS, AT NO COST TO YOU. PLEASE READ FULL DISCLOSURE HERE
What are Seeking Alpha’s top stock picks?
Exactly how do they select their stock picks?
How have Seeking Alpha’s top-rated stock picks performed in the past?
Can you actually achieve better investment returns by following Seeking Alpha stock picks?
Would you actually have avoided the recent crash in technology stocks by following Seeking Alpha’s top-rated stock picks?
After trying Seeking Alpha Premium for months, I will share with you everything that I have found and help you answer all these questions and make a more informed decision.
How Seeking Alpha Picks Top-Rated Stocks
First of all, how does Seeking Alpha select its Top Rated Stocks?
This list of top rated stocks is chosen based on both quantitative and fundamental analysis.
What is quantitative analysis?
And what is fundamental analysis?
What is the rationale behind this stock picking approach?
Is this approach superior than some other approaches?
Seeking Alpha’s quantitative analysis, indicated by “Quant Rating”, is an objective, unemotional evaluation of each stock based on data.
There are five types of Quant ratings:
- Strong Sell (i.e. a score of 1)
- Sell (i.e. a score of 2)
- Hold (i.e. a score of 3)
- Buy (i.e. a score of 4)
- Strong Buy (i.e. a score of 5)
So, how does Seeking Alpha calculate its Quant Rating?
Quant rating is derived by comparing over 100 metrics for the stock to the same metrics for the other stocks in its sector.
These metrics include the company’s financial data, stock price performance, and analysts’ estimates of future revenue and earnings.
To arrive at a Quant Rating, Seeking Alpha looks at the following five “Factor Grades”:
- Value
- Growth
- Profitability
- Momentum
- EPS Revisions
Each Factor Grade is determined by comparing the relevant metrics for the factor for the stock to those for the other stocks in the same sector.
For example, to determine the grade for the “Growth” factor, metrics such as past sales growth, projected earnings growth and stock price performance for the stock will be compared to the same metrics for the other stocks in the same sector.
To determine the grade for the “Profitability” factor, metrics such as gross margin, net margin, and return on equity for the stock will be compared to the same metrics for the other stocks in the same sector.
Then, each factor is assigned a grade, from A+ to F.
Grade A+ means that the stock has the highest growth potential compared to its peers in the same sector.
On the other hand, a grade F means that the stock has the lowest growth potential compared to its peers in the same sector
Seeking Alpha grades each stock by five “factors” — Value, Growth, Profitability, Momentum, and EPS Revisions.
The overall Quant Rating is NOT a simple average of these 5 factor grades.
Instead, some factors are given a higher weightage than others to maximize the predictive value of Quant Rating.
Also, if a stock scores very badly on one factor (a D+ or worse for Growth, Momentum, and EPS Revisions, and a D- or worse for Value and Profitability), it is disqualified as anything higher than a “Hold” Quant Rating.
Lastly, the overall Quant Rating also takes account of a stock’s size and risk, which are not included in the Value, Growth, Profitability, Momentum, and EPS Revisions grades.
Quant Rating is calculated and updated on a daily basis using the most recent data.
This way, it ensures that the recommendation is timely.
So, what do I like about Quant Rating?
First of all, it helps you find fundamentally strong companies with long-term growth potential ( Value, Growth & Profitability Factors).
At the same time, it also helps you identify the right timing to start buying these stocks by looking at Momentum and EPS Revision factors.
Finding good companies to buy is very important.
But, buying these good companies at a good price at the right time is equally important.
No one wants to see the stock price keep falling right after they have bought it.
If you have bought some of the popular high-growth technology stocks in the middle of 2021, you might be looking at an unrealized loss of up to 50% of your portfolio.
[Side Note: Could you have avoided the technology stock crash using Seeking Alpha’s Quant Rating Strong Buy signal? Instead, could you have gotten into Energy & Shipping stocks that have been rallying using the Strong Buy signal? I will examine Seeking Alpha Strong Buy Signal performance in detail below]
For example, as of 20th May 2022, here’s the performance of some popular high-growth technology stocks since its peak in 2021:
- Cloudflare is down almost 80%
- Palantir is down almost 80%
- Meta is down almost 50%
- Snowflake is down almost 60%
- Square (Now Block) is down almost 73%
- Amazon is down almost 42%
- PayPal is down almost 70%
This is the worst scenario that every investor should try to avoid.
Warren Buffett once said, “The first rule of an investment is don’t lose money. And the second rule of an investment is don’t forget the first rule. And that’s all the rules there are.”
Protecting your capital is of uttermost importance.
Here’s why.
Below is the table of “Risk of Ruin”.
When you lose 50% of your capital, you need to make 100% gain in order to just break even.
It’s very rare for a stock to go up 100% in a short period of time.
If they do go up eventually, it might take years.
Let’s not forget that there is a chance that the stock might never recover.

Seeking Alpha Quant Rating “Strong Buy” Performance
So, could Seeking Alpha’s Quant Rating help you avoid the technology stock crash in the first half of 2022?
Instead, could you have gotten into Energy & Shipping stocks that have been rallying throughout 2022 using the Seeking Alpha Strong Buy stock picks?
Also, could Seeking Alpha’s Quant Rating Strong Buy stock picks help you get back into technology stocks just when the stock market rally started in early 2023?
Let’s take a look.
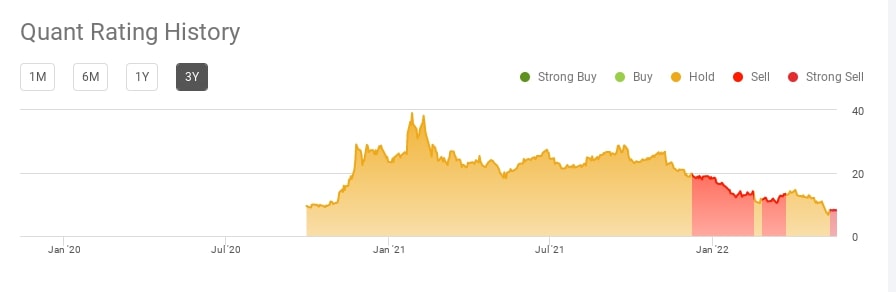
Cloudflare

The picture above is Seeking Alpha’s Quant Rating history for Cloudflare.
As you can see, there are quite a few “Strong Buy” signals for Cloudflare in Oct 2020, Dec 2020, Jan 2021, and Nov 2021.
If you had followed the rule which is to buy only when it first becomes Strong Buy and sell immediately when it is no longer a Strong Buy, you would have gotten out of your position in Cloudflare with very minimal loss or profit.
In other words, you would have avoided the huge drop in its share price.
Palantir
 The picture above is Seeking Alpha’s Quant Rating history for Palantir.
As you can see, there is no “Strong Buy” signal for Palantir from 2020 to May 2022.
In other words, you would have avoided the steep decline in share price.
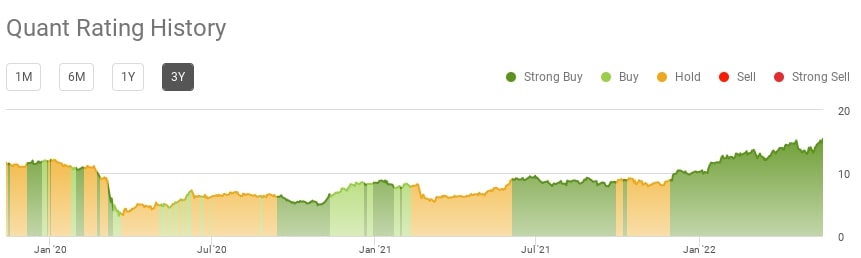
Snowflake

The picture above is Seeking Alpha’s Quant Rating history for Snowflake.
As you can see, there is a “Strong Buy” signal for Snowflake in Oct 2021, but the Strong Buy signal disappeared in late Nov 2021.
That means you would have exited your position near the top with a very small profit.
In other words, you would have avoided the steep decline in share price.
Block (Formerly Square)

The picture above is Seeking Alpha’s Quant Rating history for Block (formerly Square).
As you can see, there is no “Strong Buy” signal for Block from Jan 2020 to May 2022.
In other words, you would have avoided the steep decline in its share price.
Now, would you have gotten into Energy, Natural Resources, and Shipping stocks that have been rallying despite the market crash?
Let’s take a look.
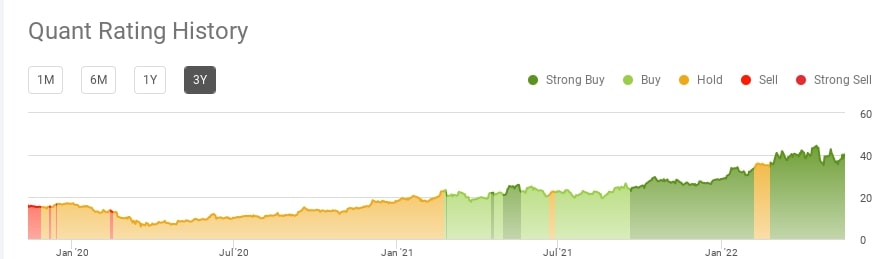
Chevron
Chevron has been a Strong Buy recommendation by Seeking Alpha since early 2021, although there was a brief period of time when the rating was changed to Hold.
If you had followed the Strong Buy recommendation, you would not miss the oil stock rally.

PBR-Petróleo Brasileiro S.A. – Petrobras
Petrobras has been a Strong Buy recommendation by Seeking Alpha since June 2021, although there was a brief period of time when the rating was changed to Hold.
If you had followed the Strong Buy recommendation, you would not miss the oil stock rally.
Teck Resources
Petrobras has been a Strong Buy recommendation by Seeking Alpha since Sep 2021, although there was a brief period of time when the rating was changed to Hold.
If you had followed the Strong Buy recommendation, you would not miss the natural resources stocks rally.
As you can see, Seeking Alpha Quant Rating would have helped you avoid the technology crash and also gotten into the commodities stock rally.
So, could you have used Seeking Alpha Quant Ratings to get back into the oversold technology stocks at the start of the stock market rally in early 2023?
Below are the Seeking Alpha Quant Ratings for the mega-cap technology stocks.
Meta (previously Facebook)


So, how have Seeking Alpha’s Strong Buy Recommendations compared against the S&P 500?
Do take note that the performance is based on backtesting.
From 2010 to March 2024 (as of my writing), Seeking Alpha Strong Buy achieved a total return of $245,380 based on $10,000 in investment capital while the S&P 500 achieved a total return of $51,032.

[Note: Past performance is no guarantee of future results. Therefore, you should not assume that the future performance of any specific investment or investment strategy will be profitable or equal to corresponding past performance levels.]
Pricing-wise, Seeking Alpha is also much more affordable than Gurufocus.
For Seeking Alpha, there are three types of pricing plans:
- Basic: Free
- Seeking Alpha Premium:
$299/year$269/year (i.e. about $5.17/week) - Seeking Alpha Pro: $2400 per year
[Limited Time Only] Claim $30 OFF Seeking Alpha Premium & Try It For 7 Days Free
How To Use Seeking Alpha’s Strong Buy Recommendations
So, how do you effectively use Seeking Alpha’s Strong Buy stock picks?
Seeking Alpha’s Strong Buy stock picks are based on Quant Rating.
Quant Rating is derived from Seeking Alpha’s proprietary algorithm that uses the most recent financial and fundamental data.
It’s updated daily to make sure that the stock recommendation is timely.
Personally, I use Quant Rating Strong Buy recommendations together with Wall Street Rating and Seeking Alpha Author Rating.
Why?
If both the Wall Street Rating and Seeking Alpha Author Rating are high (i.e. above 4), it increases the probability of the recommendation being right.
In case you are not familiar with Seeking Alpha stock ratings, there are three different types of ratings:
- SA Author Ratings ‒ ranging from Strong Buy to Strong Sell
- Wall Street Ratings – consensus and price targets on the stock by Wall Street Analysts
- Quant Ratings ‒ based on over 100 metrics, updated daily
Also, if the factor grades are all A, then it could be potentially a high-probability investment opportunity.
But, it is quite rare to get it.
If you ever do see all the factor grades being A, then it is worth taking a closer look at the stock.
Now, let’s take a look at one of Seeking Alpha’s top-rated stocks.
Rolls Royce has been one of Seeking Alpha’s Top Rated Stocks since April 2023 when its share price was about $1.87.
As of April 2024, its share is about $4.97, which is up more than 100% in about one year.

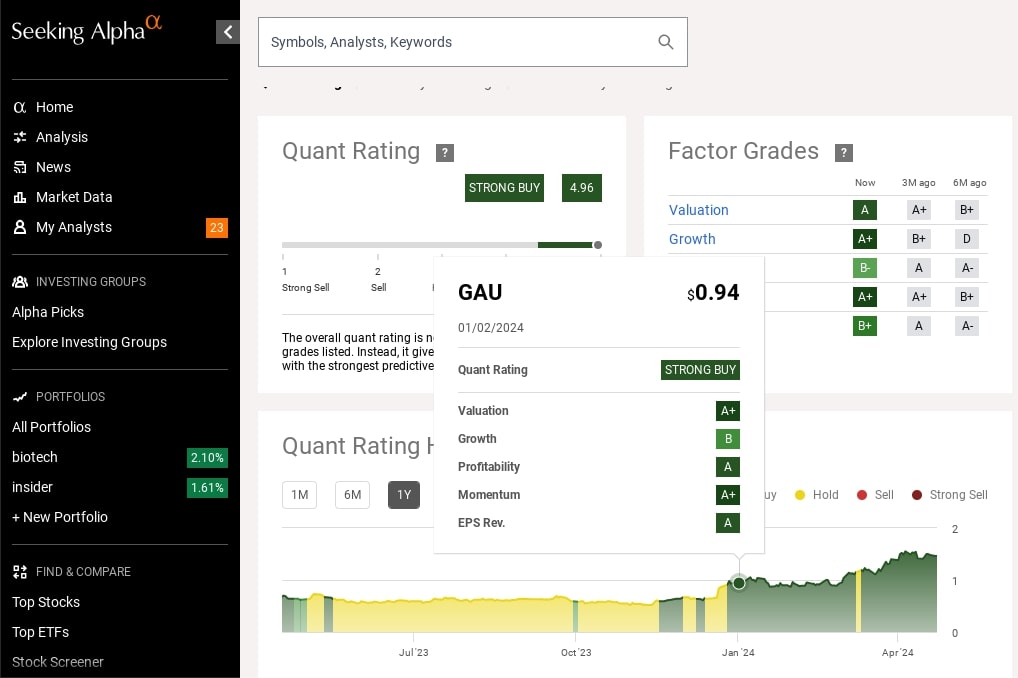
Here’s a more recent strong buy stock recommendation.
Galiano Gold was rated a Strong Buy in Jan 2024 when its share price was $0.94.
Less than 4 months later (22nd April 2024), its share price went up by almost 50%.
Personally, I use Seeking Alpha’s Strong Buy stock recommendations as potential investment ideas.
[Limited Time Only] Claim $30 OFF Seeking Alpha Premium & Try It For 7 Days Free
Leave a Reply