DISCLOSURE: THIS POST MAY CONTAIN AFFILIATE LINKS,MEANING That I GET A COMMISSION IF YOU DECIDE TO MAKE A PURCHASE THROUGH MY LINKS, AT NO COST TO YOU. PLEASE READ FULL DISCLOSURE HERE
Whether you are investing in stocks for the long term or just trading stocks in the short term, a good stock screener is a must-have because it helps you save time and make your stock research much easier and faster.
Personally, I’ve tried almost every single one of the stock screeners out there (both free and paid).
So, which is the best stock screener?
How do you decide which stock screener is the right one for you?
Also, do you really need to get a paid stock screener?
Most importantly, how do you use it effectively to help you invest better or trade better?
What Is A Stock Screener?
A stock screener is a tool that you can use to find stocks based on the metrics that you’ve selected.
There are three main types of metrics that you will use as filters in a stock screener:
- Descriptive
- Fundamental
- Technical
So, what is a descriptive metric?
Descriptive metrics refer to stock information such as its industry, market capitalization, which stock exchange it’s listed on, date of the earnings release, number of shares outstanding, and average trading volume.
What about fundamental metrics?
Fundamental metrics refer to the underlying company’s financial and operational metrics such as its sales, earnings, cash flow, profitability, debt levels, valuation, and growth.
With fundamental metrics, you can filter stocks of profitable businesses (for investment ideas) and struggling businesses (for short-selling opportunities).
Now, what are technical metrics?
Technical metrics are generally derived from technical indicators or stock price and volume.
For example, a few examples of the technical metrics purely based on stock price are 52-week high, 52-week low, all-time low, and all-time high.
If you are familiar with price action and candlestick patterns, there are also technical metrics based on patterns such as double top, double bottom and bearish/bullish engulfing candle.
Lastly, there are technical metrics based on indicators.
Some of the most well-known indicators are the moving average, RSI, MACD, and Bolligent bands.
Here are just a few examples of technical metrics based on moving averages:
- Price below 200-day moving average (i.e. in a long-term downtrend)
- Price above 200-day moving average (i.e. in a long-term uptrend)
- Price crossing above 200-day moving average (i.e. about to enter a long-term uptrend)
- Price crossing below 200-day moving average (i.e. about to enter a long-term downtrend)
Now that you have a basic understanding of what a stock screener is, let’s move on to talk about what you should look for in a stock screener as well as how to use a stock screener.
What To Look For In A Stock Screener
So, what should you look for in a stock screener?
First of all, you need to know what you are using a stock screener for.
Are you looking for a stock screener to find stocks for long-term investments?
Or are you looking for a stock scanner for intra-day trading?
Or are you looking for a stock screener to find stocks for swing trading?
Depending on what your objective is, you will evaluate the features of a stock screener very differently.
For example, if you are a value investor who wants to use a stock screener to find good undervalued stocks, then you will need a stock screener that is specifically designed for fundamental analysis and value investing.
You will want to see a lot of fundamental metrics, especially metrics related to value investing (such as fair value and margin of safety), in the stock screener.
On the other hand, if you are a trader who wants a stock scanner to help scan the stock market for profitable trade setups in real-time, you will be looking at totally different kinds of features in a stock scanner.
For example, you will want to see a lot of technical metrics because traders mostly use technical analysis to make trading decisions.
Once you know what you are using a stock screener for, here is a list of things that you want to consider while choosing a stock screener:
- What stock market does it cover? Does it screen only US stocks or does it screen international stocks?
- What metrics are included in the stock screener or scanner?
- How many metrics are there?
- Can you mix and match these metrics to customize your stock screener or scanner without any coding?
- Are there real-time alerts that you can create to alert you whenever these pre-defined conditions are met?
- How much does it cost? If it is not free, then is there a free trial to test-drive it risk-free.
- How good are the reviews?
Best Stock Screener For Fundamental Analysis – Stock Rover
Stock Rover is a stock analysis and research platform that is specifically designed and built for fundamental analysis.
Personally, I am a Stock Rover Premium Plus user, so I can tell you my first-hand experience of using its stock screener for my research.
Inside Stock Rover, there are many useful tools, but below are the three most powerful research tools of all:
- Stock Screener
- Dynamic Tables For Direct Stock Comparison
- Stock Research Report
First, let’s talk about Stock Rover Screener.
Stock screener is probably one of the most important tools in any stock research and analysis platform.
So, how good is Stock Rover stock screener?
First of all, Stock Rover provides over 650 metrics.
To put it in perspective for you, the FREE stock screeners you can easily find online provides you with much much fewer metrics (i.e. less than 100).
Stock Rover’s metrics cover a wide range of areas such as earnings, growth, profitability, financial strength, capital efficiency, price performance, momentum, dividends, analyst ratings, and stock ratings.
Basically, you have ALL the financial and fundamental data on any US & Canada Stocks in one place.
If you are an experienced value investor, you will be thrilled to know that Stock Rover also provides advanced metrics such as the Fair Value, Margin of Safety and Piotroski F-Score.
What’s more, most metrics come with a detailed 10-year history for you to get a complete picture of how the company has been doing.
With Stock Rover, you no longer have to cobble together multiple sources and tools to do your stock research and analysis.
So, how can you use Stock Rover Stock Screener to identify good investment opportunities?
With thousands of stocks listed on the stock exchange, it’s always a good idea to use a stock screener to help you find stocks that meet your investment criteria.
Stock Rover stock screener is probably one of the most powerful fundamental stock screeners because of the sheer number of fundamental filters they have.
There are over 550 filters for you to choose from, and you can mix and match any number of filters you like.
Below is a screenshot of all the filters as well as its different categories.
For example, if you are looking for stocks that must fulfil certain growth criteria, you can click on the “Growth” category and you will see all the 29 different filters under “Growth”.
Let’s say you want all the stocks with a 5-year Average Sales growth rate of at least 10%, you can do that easily with Stock Rover.

Now, here’s the best part.
You can create your own customized screener, and even back-test it using 10 years of historical data that Stock Rover provides.
For example, I have been using my Stock Rover Premium Plus account (by the way, you can test drive all its features for 14 days free. no credit card required)to test different stock screener ideas.
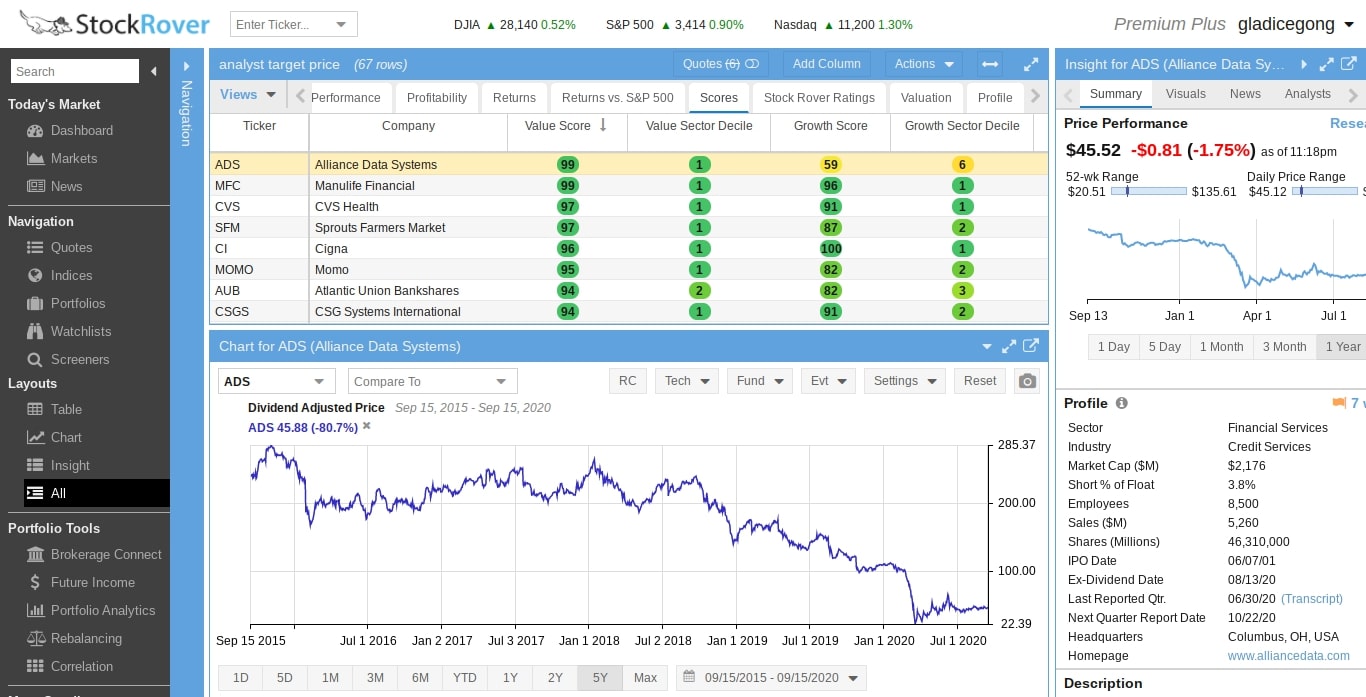
Here’s one of my screeners based on analysts’ target price and Piotroski F-Score:
- Analysts’ stock price target percentage change of at least 30% (i.e. upside potential)
- Piotroski F-Score of at least 5 (i.e. good financial health)
- Stock price of at least $10 and above (i.e. no penny stocks)
“Piotroski F-score is a number between 0 and 9 which is used to assess the strength of company’s financial position. The score is used by financial investors in order to find the best value stocks (nine being the best). “
So far, Stock Rover is probably the ONLY stock research and analysis platform that provides the most comprehensive financial and fundamental information on US & Canada stocks in one place.
Next, it’s the dynamic and easy-to-use “Table” that you can use for side-by-side stock comparison and evaluation.
The Table is a very powerful comparison tool that can sort, filter, color rows, pulls up-to-date financials and pricing data, and lets you dynamically swap out datasets with just a click.
So, there is no need for you to learn all the different Excel functions to do stock comparison analysis by yourself!
My third favorite research tool is Stock Rover’s research reports.
Unlike the free research reports you get from your brokers, Stock Rover‘s research reports are updated in real-time, so all the financial data are up-to-date.
Also, you get everything you need to know(e.g. valuations, profitability, growth, peer analysis, etc), about the stock to determine if it is a fundamentally strong company to invest in.
Try Stock Rover Risk-Free For 14 Days Now (No Credit Card Required)
Best Stock Screener For day Trading – Trade Ideas
Trade Ideas is an artificial intelligence trading software that helps traders and investors scan through the market to look for profitable trading opportunities quickly, so you can be the first to act.
One of the biggest challenges as a trader is to have to look through the massive amount of market data (i.e. stock prices, charts, transactions, volume, news, etc) and find profitable trade ideas to execute in a timely manner.
with artificial intelligence trading software, things are different.
It can watch each and every trade of every stock in the markets and notify you about profitable trade opportunities in real-time during market hours based on your pre-defined filtering requirements and also event trigger settings, so you can be the first to act.
For example, let’s say you are looking for potential trade opportunities to buy stocks that are about to break out of its 20 day trading range.
Trade Ideas is able to scan the ENTIRE market to help you filter stocks that meet your requirements and even send you a price alert, so you don’t miss out on any good trades.
Or let’s say you are looking for potential trade opportunities to short stocks that are going to make new highs but it has a high short float.
Trade Ideas can help you find such trade opportunities in real-time and update you continuously throughout the market hours.
Now, what if you don’t have your own proven trading strategy?
That’s is where Trade Ideas A.I. Technology comes in.
Trade Ideas has a machine learning Artificial Intelligence named Holly that looks at what happened in today’s market and then tests 70 proprietary algorithms after market close.
It looks at everything: long, short, cheap and expensive, fundamental, social, technical data, and everything volume-driven.
Then, it runs over a million trading scenarios overnight, and identify what is working in a down market or in an upmarket.
So, only the strategies with a success rate above 60% and a 2:1 Profit Factor are presented to you the following day, together with suggestions on exactly when to buy or short and when to exit.
One of the most popular stock scanning tools is “Top List Window”.
Top List Windows
So, what is a Top List Window?

What a top list window does is that it shows you all the stocks based on your pre-defined filters.
As a trader, you might want to trade stocks that are liquid and have a high trading volume, and also you might want to trade a stock that is within a specific price range (e.g. above $5 and below $70).
Of course, there are a lot of other filters that you can choose from, depending on your trading strategy and style.
So, once you’ve selected your filters, and then “Top List Window” will show you a list of stocks that satisfy your requirements.
What kind of filters does Trade Ideas offer?
It offers a huge number of technical filters and a decent number of fundamental filters.
Below is just a small sample of technical filters.

Lastly, Top List Window updates every 30 seconds, so you will always stay up to date with the market.
On top of the massive amount of technical filters, you also get access to a lot of indicator-based trading setup filters and price-based trading setup filters.
For example, you can filter stocks that are 75% pullback from today’s lows (Close)
So, what it does is that it lets you know all the stocks that return 75% of the way from the low back to yesterday’s close.
Here’s another example.
It can help you scan for stocks that have shown the green bar reversal (GBR) pattern based on a candlestick chart.
You will get a stock alert when a stock has gone down for three or more consecutive candles, and then it has a green candle.
If you are trading based on technical analysis, then Trade-Ideas is the perfect stock scanner for you.
Lastly, it also provides stock filters based on social media mentions which is very unique to Trade Ideas.
For example, it tracks and monitors interesting events based on the frequency of social media mentions and unusual mention activity.
Let’s say you want to know what stocks are getting mentioned at least 5 times more than usual on social media.
Then, you can set the social media mention filter, and you will see a list of stocks that meet your filter requirements.
Pros:
- Tons of technical filters for stocks
- Real-time alerts based on the pre-defined filters (indicator-based trade setups or price-based trade setups)
- Access to high probability trading opportunities based on over a million trading scenario simulations
- Great for day traders
Cons:
- It’s not cheap
- It’s only for stock day trading
Try Trade Ideas for Free Now
Best Stock Screener For Trend Trading – MarketClub
MarketClub‘s Smart Scan allows you to choose from 24 different scans which are all specifically designed to find stocks with the strongest trend.

Here are just some examples of the different scans available:
- New 1 Week High/Low
- New 3 Week High/ Low
- New 4 Week High/ Low
- New 52 Week High
- New 52 Week Low
- Strong DMA Trends
- Weak DMA Trends
- Chart Analysis +100
- Chart Analysis -100
Now, what is MarketClub’s Chart Analysis Score?
It is a proprietary tool that measures trend strength and direction, taking into account intraday price action, new daily, weekly and monthly highs and lows, and moving averages.
Moreover, this Chart Analysis Score will dynamically update depending upon intraday price action and as new highs or lows occur.
For example, here’s how you can view the positive score:
50 to 65 : Trading Range (i.e. moving sideways)
70 to 80 : Emerging Uptrend
85 to 100 : Strong Uptrend
The converse is true for the negative score.
So, how do you use the Smart Scan?
Once you choose the type of scan, you can then set the parameters of the markets that are returned.
You can filter by security type, price, and volume, as well as separate US, Canadian, and Australian exchanges.
Then, you can set how you would like the results to be displayed, whether charts or a list.
Together with the Trade Triangle signals, it can help you identify good trading opportunities to long or short the stock.
For me, I am always looking at Chart Analysis Score of at least 85 and above for buying opportunities and a score of at least -85 or below for shorting opportunities.
Why?
Because it gives me trade opportunities with the highest probability to win.
If you are a swing trader, MarketClub Smart Scan is perfect to help you scan the different markets for high probability trade ideas.
Try out MarketClub For Free Now
Finviz
Finviz is one of the best free stock screeners out there.
Personally, I’ve been using it for years to help me research and analyze stocks.
The most useful tool on FinViz is the stock screening tool.
If you are a registered user, you can use the “screen preset” to save all your searches.
So next time, you don’t have to set your filters all over again just to narrow down the list of stocks.
There are three main types of filters:
- Descriptive (e.g. capitalization, stock exchange, country, industry, etc)
- Fundamental (e.g. P/E ratio, Debt equity ratio, dividend yield, etc)
- Technical (e.g. above 200-day moving average, RSI, chart pattern, gap, etc)
When you break it down, there is a combined total of over 60 filters for you to play with.
What I love about FinViz is that it makes it so easy and quick to filter stocks based on my own stock selection criteria and helps me save so much time in the process.
To save your searches as a “preset”, you must first register with FinViz using just your email address. (it’s free to register)
I have a lot of “presets” saved, so I don’t have to set the filters every time I want to check on the stocks.
Pros:
- It’s very easy to use
- It’s also free to use most of its features, which is awesome.
- There are over 60 filters to help you screen stocks
- There are also presets to help you save your searches
- You can get real-time stock data and advanced charting tools as a paid user
- You can get instant e-mail alerts for individual stocks and portfolios as a paid user whenever the alerts are triggered by these events such as News & ratings, Price or New ticker that fits Screener criteria
Cons:
- If you are not a paid user, then you will have to put up with the annoying advertisements.
Try FinViz for Free Now
Morningstar
Just like Finviz, Morningstar also offers a free and paid stock screener.
The difference is that Finviz’s free version offers much more in terms of filters and preset.
For Morningstar’s basic free version of the stock scanner, you get a total of 18 filters from the following 5 different categories:
Stock Basics:
- Stock Sector
- Morningstar stock type (Aggressive growth, slow growth, cyclical, distressed, etc)
- Morningstar equity style box (Large value, small growth, large growth, small value, etc)
- Minimum market capitalization
Morningstar stock grades:
- Growth grade
- Profitability grade
- Financial health grade
Company performance:
- 3-year revenue growth
- Return on equity (ROE)
- 5-year forecasted earnings growth
Stock Performance
- YTD total return
- 1-month total return
- 3-month total return
- 1-year total return
- 5-year total return
Valuation
- Trailing P/E ratio
- P/E-to-Earnings Growth Ratio (PEG)
- Dividend yield
Out of these 18 filters, Morningstar stock grade, stock type and equity style are filters that are based on analyst’s opinions.
All the remaining filters are based on hard facts and statistics that are commonly available to everyone.
While the free version of Morningstar stock screener doesn’t really offer much, you will get more filters if you upgrade to the premium account.
As a Morningstar premium subscriber, you will get access to the following:
- Morningstar Rating for Stocks (i.e. the analysts’ star rating of the stocks with five stars being the best)
- The Wide Moat screener for stocks (i.e. competitive advantage of the stock’s underlying company)
- Fair Value Uncertainty for stocks (i.e. level of uncertainty of Morningstar’s valuation of the stock)
- The Medalist screener for funds (equity fund, bond fund, ETFs, mutual funds, etc)
So, the key difference between Morningstar‘s stock screener and other stock screeners is that you get access to the stock ratings, wide moat screener for stocks, analysts’ valuation of the stocks, medalist rating for funds according to the Morningstar analysts.
That means you are essentially buying the expertise and knowledge of the Morningstar analysts.
Pros:
- You get unique filters that are based on Morningstar analysts’ stock rating and analysis as a Morningstar premium subscriber
- Access to analyst’s fund ratings and analysis as a Morningstar premium user
- Access to analyst research report as a Morningstar premium user
- Access to portfolio x-ray which is a tool to help you track and analyze your investment portfolio as a Morningstar premium user
Cons:
- Much fewer filters for stocks compared with FinViz
Zacks
Zacks has a free and paid version of stock screener.
For the free stock screener, there are quite a number of fundamental filters you can use:
- Company Descriptors (i.e. sector, industry, stock exchange, etc)
- Size & Share Volume (i.e. market cap, etc)
- Price & Price Changes (i.e. 52 weeks high, last close, price as a % of 52-week range, etc)
- Broker Rating & Changes
- EPS Surprises & Actuals
- EPS Estimate Revisions
- EPS Estimates
- EPS Growth
- Sales, Growth & Estimates
- Valuations
- Return on Investment
- Income Statement & Growth
- Dividends
- Margins & Turnover
- Balance Sheet
- Liquidity & Coverage
So, is there anything unique about Zacks stock screener?
Yes, Zacks puts a lot of emphasis on EPS (i.e. earnings per share) as well as analysts’ earnings estimates and earnings estimate revisions.
This is because Zacks’ Founder and CEO, Len Zacks thinks that “Earnings estimate revisions are the most powerful force impacting stock prices.”
As a result, Zacks developed its own stock ranking called Zacks Ranks based on this theory.
So, how does Zacks Rank work?
Basically, if the stock’s earnings estimate is revised higher, then the Zacks’ rank of the stock will be high.
Conversely, if the stock’s earnings estimate is revised lower, then the Zacks’ rank of the stock will be low.
There are a total of 5 different ranks:
- Zacks Rank #1 (i.e. Strong Buy)
- Zacks Rank #2 (i.e. Buy)
- Zacks Rank #3 (i.e. Hold)
- Zacks Rank #4 (i.e. Sell)
- Zacks Rank #5 (i.e. Strong Sell)
But you will only get access to Zacks Rank in the stock screener if you subscribe to its premium service.
However, these stock ratings are ONLY for short-term trading (i.e. the next 1 to 3 months), but not for long-term investment.
Why?
Publicly traded companies are required to report their quarterly earnings, so the “earnings estimate revisions” indicator that Zacks uses is ONLY valid for at most one quarter.
When you get the paid stock screener, you will also get access to the Earnings ESP (i.e. Expected Surprise Prediction) Filter.
This filter can be used to search for stocks to buy beforehand that have the highest probability of positively surprising for profitable earnings season trading.
Pros:
- You get access to quite a large number of fundamental filters in the free version of stock scanner
- Access to Zacks Rank in the paid version of stock screener
- Access to Earnings ESP (i.e. Expected Surprise Prediction) Filter in the paid version of the stock screener
- Focus List of 50 stocks for the long haul
Cons:
- Its stock ranking is entirely based on earnings estimate revisions
- It’s mostly suitable for short-term stock trading
Yahoo Stock Screener
Yahoo Finance also offers a pretty cool free stock screener.
It’s essentially a fundamentals stock screener because all its filters are about stock fundamentals.
So, if you are a stock investor who primarily uses fundamental analysis to pick stocks, you will find Yahoo Finance Stock Screener very useful.
It has 8 types of filters to help you scan stocks:
- Share Statistics (Price, Volume, Shares Outstanding, Ownership, etc)
- Balance Sheet
- Income (EPS, Revenue, Net Income, EBITA, etc)
- Valuation Measures (P/E, P/B, Book Value/share, P/S, etc)
- Cashflow statement (free cash flow, CapEx, Cash from operations, Days Sales Outstanding, etc)
- Dividends and Splits (
- ESG Scores (
- Sector & Industry
- Financial Highlights (
As you can see from the above, you have to be very familiar with financial statements and accounting jargon to use this stock scanner effectively.
MarketWatch Stock Screener
MarketWatch also offers a free stock screener, but it is a much simpler stock screener.
The number of filters is very limited.
There are a total of 10 filters from the following 5 categories:
Price
- Share price
- % up/down in price
- trading below 52 week low or above 52 week high
Volume
- Current trading volume
Fundamentals
- P/E ratio
- market capitalization
Technicals
- Outperforming/underperforming their 50 day( or 200 day) moving average
- Outperforming/underperforming the chosen market index below by %
Exchange & Industry
-
- Industry ( Energy, Basic Materials, Food/Beverage, Agriculture, Financial Services, etc)
Personally, I think that MarketWatch free stock screener is pretty weak compared with all the other free stock screeners.
Thanks, Gladice for this beautiful article. You have described a very nice point to point about best stock screeners. I appreciate your writing skills & thoughts. Well done.